

316
Chemical Oceanography, 4th Edition
results at Hawaii are shown in Figure 7.65 and indicate that the pH of the surface waters
is decreasing by about 0.002 each year. Measurements of the pH at BATS and the ESTOC
time series station also showed a similar decrease in the pH as a function of time. The longterm decrease in the pH of the surface ocean from 8.1 to 7.4 will increase the TCO 2 by 12%,
decrease the CO 3
2– ion by 60%, and decrease the OH – ion by 78%.
The expected higher pCO 2 over the next 1000 yr will decrease the CO 3
2– ion and the
saturation state (Ω). The expected change in Ω is shown in Figure 7.66 (Millero et al., 2009).
The decrease in Ω and the carbonate ion will make it much more difficult for calcifying
organisms to make shells (Kleypas et al., 1999; Riebesell et al., 2000; Orr et al., 2005; Royal
Society, 2005; Doney et al., 2009a). Most studies that have examined the effect of decreases
of pH have been made on the changes in the saturation state of CaCO 3 in surface oceans
(Doney et al., 2009a). The saturation state may be less than 1.0 in 200 yr and remain this low
for a long time. This will result in difficulty of corals and other calcifiers to survive. The
effect of lower saturation states on the growth of corals has been studied by Langdon and
Anderson (2005); the results are shown in Figure 7.67. Most of the recent results for ocean
acidification experiments for calcification, photosynthesis, nitrogen fixation, and reproduction are shown in Figure 7.68 (Doney et al., 2009a).
Photosynthesis and nitrogen fixation increase with lower pH. Most of the calcification
and reproduction experiments have shown decreases with lower pH. The exception is
for coccolithophores, which show a mixed behavior. The result for some show a decrease
0
500
1000
1500
Depth (m)
0
500
1000
1500
Depth (m)
150°E
140°E
160°E
–10
–5
0
5
∆C anthro. (µmol kg –1 )
10
15
20
170°E
180°
170°W
Longitude
(a)
(b)
160°W 150°W 140°W 130°W
60°S
70°S
50°S 40°S 30°S 20°S 10°S
10°N 20°N 30°N 40°N
0°
Latitude
50°N
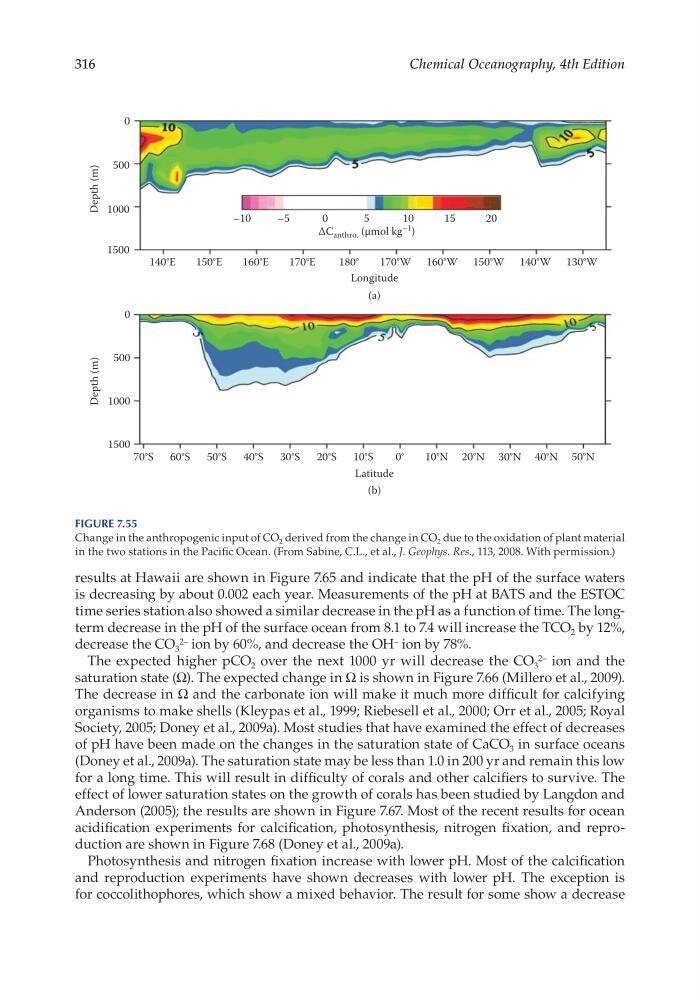
Figure 7.55
Change in the anthropogenic input of CO 2 derived from the change in CO 2 due to the oxidation of plant material
in the two stations in the Pacific Ocean. (From Sabine, C.L., et al., J. Geophys. Res., 113, 2008. With permission.)
Chemical Oceanography, 4th Edition
results at Hawaii are shown in Figure 7.65 and indicate that the pH of the surface waters
is decreasing by about 0.002 each year. Measurements of the pH at BATS and the ESTOC
time series station also showed a similar decrease in the pH as a function of time. The longterm decrease in the pH of the surface ocean from 8.1 to 7.4 will increase the TCO 2 by 12%,
decrease the CO 3
2– ion by 60%, and decrease the OH – ion by 78%.
The expected higher pCO 2 over the next 1000 yr will decrease the CO 3
2– ion and the
saturation state (Ω). The expected change in Ω is shown in Figure 7.66 (Millero et al., 2009).
The decrease in Ω and the carbonate ion will make it much more difficult for calcifying
organisms to make shells (Kleypas et al., 1999; Riebesell et al., 2000; Orr et al., 2005; Royal
Society, 2005; Doney et al., 2009a). Most studies that have examined the effect of decreases
of pH have been made on the changes in the saturation state of CaCO 3 in surface oceans
(Doney et al., 2009a). The saturation state may be less than 1.0 in 200 yr and remain this low
for a long time. This will result in difficulty of corals and other calcifiers to survive. The
effect of lower saturation states on the growth of corals has been studied by Langdon and
Anderson (2005); the results are shown in Figure 7.67. Most of the recent results for ocean
acidification experiments for calcification, photosynthesis, nitrogen fixation, and reproduction are shown in Figure 7.68 (Doney et al., 2009a).
Photosynthesis and nitrogen fixation increase with lower pH. Most of the calcification
and reproduction experiments have shown decreases with lower pH. The exception is
for coccolithophores, which show a mixed behavior. The result for some show a decrease
0
500
1000
1500
Depth (m)
0
500
1000
1500
Depth (m)
150°E
140°E
160°E
–10
–5
0
5
∆C anthro. (µmol kg –1 )
10
15
20
170°E
180°
170°W
Longitude
(a)
(b)
160°W 150°W 140°W 130°W
60°S
70°S
50°S 40°S 30°S 20°S 10°S
10°N 20°N 30°N 40°N
0°
Latitude
50°N
Figure 7.55
Change in the anthropogenic input of CO 2 derived from the change in CO 2 due to the oxidation of plant material
in the two stations in the Pacific Ocean. (From Sabine, C.L., et al., J. Geophys. Res., 113, 2008. With permission.)