

8
Chemical Oceanography, 4th Edition
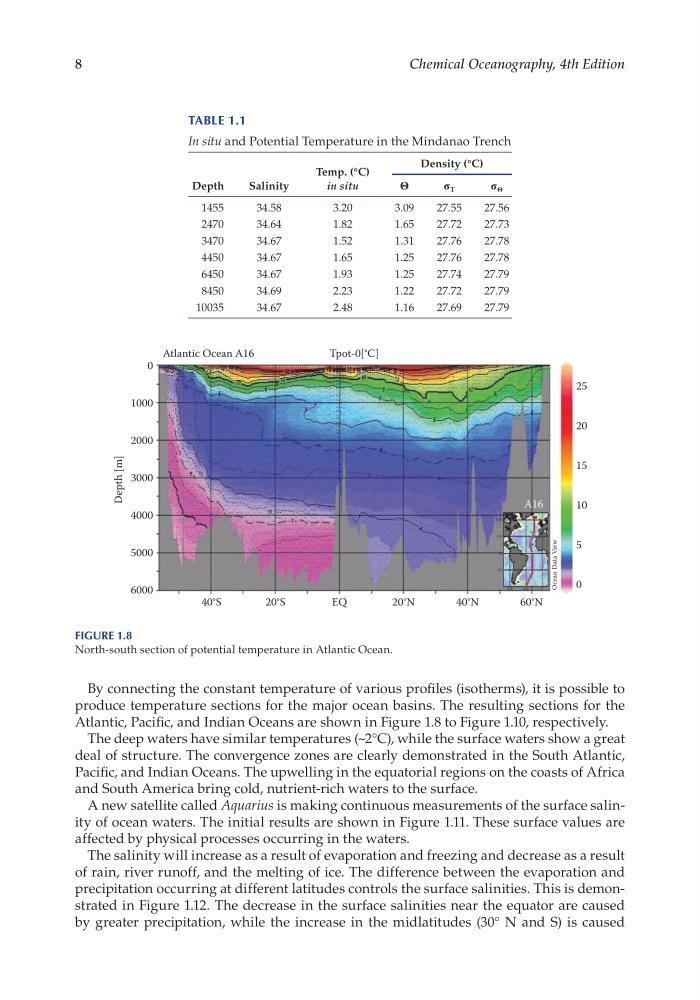
By connecting the constant temperature of various profiles (isotherms), it is possible to
produce temperature sections for the major ocean basins. The resulting sections for the
Atlantic, Pacific, and Indian Oceans are shown in Figure 1.8 to Figure 1.10, respectively.
The deep waters have similar temperatures (~2°C), while the surface waters show a great
deal of structure. The convergence zones are clearly demonstrated in the South Atlantic,
Pacific, and Indian Oceans. The upwelling in the equatorial regions on the coasts of Africa
and South America bring cold, nutrient- rich waters to the surface.
A new satellite called Aquarius is making continuous measurements of the surface salinity of ocean waters. The initial results are shown in Figure 1.11. These surface values are
affected by physical processes occurring in the waters.
The salinity will increase as a result of evaporation and freezing and decrease as a result
of rain, river runoff, and the melting of ice. The difference between the evaporation and
precipitation occurring at different latitudes controls the surface salinities. This is demonstrated in Figure 1.12. The decrease in the surface salinities near the equator are caused
by greater precipitation, while the increase in the midlatitudes (30° N and S) is caused
40°S
6000
5000
4000
Depth [m]
3000
2000
1000
0
20°S
EQ
Tpot-0[°C]
Atlantic Ocean A16
20°N
40°N
60°N
25
20
15
10
A16
5
0
Ocean Data View
Figure 1.8
North- south section of potential temperature in Atlantic Ocean.
Table 1.1
In situ and Potential Temperature in the Mindanao Trench
Depth
Salinity
Temp. (°C)
in situ
Density (°C)
Θ
σ T
σ Θ
1455
34.58
3.20
3.09
27.55
27.56
2470
34.64
1.82
1.65
27.72
27.73
3470
34.67
1.52
1.31
27.76
27.78
4450
34.67
1.65
1.25
27.76
27.78
6450
34.67
1.93
1.25
27.74
27.79
8450
34.69
2.23
1.22
27.72
27.79
10035
34.67
2.48
1.16
27.69
27.79
Chemical Oceanography, 4th Edition
By connecting the constant temperature of various profiles (isotherms), it is possible to
produce temperature sections for the major ocean basins. The resulting sections for the
Atlantic, Pacific, and Indian Oceans are shown in Figure 1.8 to Figure 1.10, respectively.
The deep waters have similar temperatures (~2°C), while the surface waters show a great
deal of structure. The convergence zones are clearly demonstrated in the South Atlantic,
Pacific, and Indian Oceans. The upwelling in the equatorial regions on the coasts of Africa
and South America bring cold, nutrient- rich waters to the surface.
A new satellite called Aquarius is making continuous measurements of the surface salinity of ocean waters. The initial results are shown in Figure 1.11. These surface values are
affected by physical processes occurring in the waters.
The salinity will increase as a result of evaporation and freezing and decrease as a result
of rain, river runoff, and the melting of ice. The difference between the evaporation and
precipitation occurring at different latitudes controls the surface salinities. This is demonstrated in Figure 1.12. The decrease in the surface salinities near the equator are caused
by greater precipitation, while the increase in the midlatitudes (30° N and S) is caused
40°S
6000
5000
4000
Depth [m]
3000
2000
1000
0
20°S
EQ
Tpot-0[°C]
Atlantic Ocean A16
20°N
40°N
60°N
25
20
15
10
A16
5
0
Ocean Data View
Figure 1.8
North- south section of potential temperature in Atlantic Ocean.
Table 1.1
In situ and Potential Temperature in the Mindanao Trench
Depth
Salinity
Temp. (°C)
in situ
Density (°C)
Θ
σ T
σ Θ
1455
34.58
3.20
3.09
27.55
27.56
2470
34.64
1.82
1.65
27.72
27.73
3470
34.67
1.52
1.31
27.76
27.78
4450
34.67
1.65
1.25
27.76
27.78
6450
34.67
1.93
1.25
27.74
27.79
8450
34.69
2.23
1.22
27.72
27.79
10035
34.67
2.48
1.16
27.69
27.79