

7
Descriptive Oceanography
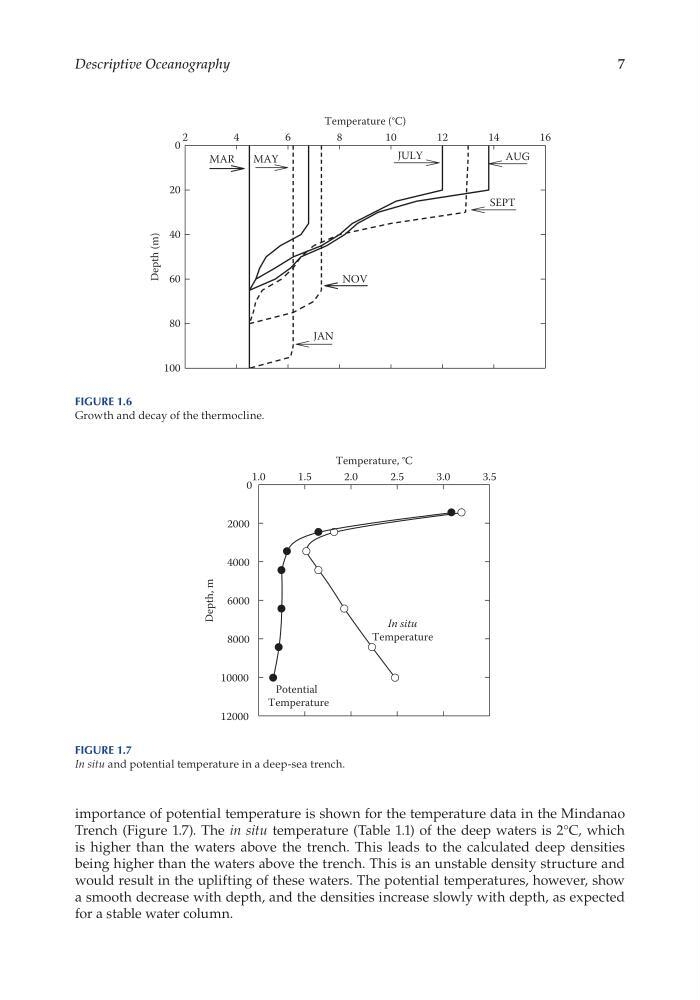
importance of potential temperature is shown for the temperature data in the Mindanao
Trench (Figure 1.7). The in situ temperature (Table 1.1) of the deep waters is 2°C, which
is higher than the waters above the trench. This leads to the calculated deep densities
being higher than the waters above the trench. This is an unstable density structure and
would result in the uplifting of these waters. The potential temperatures, however, show
a smooth decrease with depth, and the densities increase slowly with depth, as expected
for a stable water column.
Temperature (°C)
2
4
6
8
10
12
14
16
Depth (m)
0
20
40
60
80
100
MAR
MAY
NOV
JAN
JULY
AUG
SEPT
Figure 1.6
Growth and decay of the thermocline.
Temperature, °C
1.0
1.5
2.0
2.5
3.0
3.5
Depth, m
0
2000
4000
6000
8000
10000
12000
In situ
Temperature
Potential
Temperature
Figure 1.7
In situ and potential temperature in a deep- sea trench.
Descriptive Oceanography
importance of potential temperature is shown for the temperature data in the Mindanao
Trench (Figure 1.7). The in situ temperature (Table 1.1) of the deep waters is 2°C, which
is higher than the waters above the trench. This leads to the calculated deep densities
being higher than the waters above the trench. This is an unstable density structure and
would result in the uplifting of these waters. The potential temperatures, however, show
a smooth decrease with depth, and the densities increase slowly with depth, as expected
for a stable water column.
Temperature (°C)
2
4
6
8
10
12
14
16
Depth (m)
0
20
40
60
80
100
MAR
MAY
NOV
JAN
JULY
AUG
SEPT
Figure 1.6
Growth and decay of the thermocline.
Temperature, °C
1.0
1.5
2.0
2.5
3.0
3.5
Depth, m
0
2000
4000
6000
8000
10000
12000
In situ
Temperature
Potential
Temperature
Figure 1.7
In situ and potential temperature in a deep- sea trench.