

190
Chemical Oceanography, 4th Edition
the earth, while lighter gases (H 2 , He) extend to the outer atmosphere. The distribution of
gases in the atmosphere is related to their lifetimes. The atmospheric lifetimes vary from
seconds to hundreds of years (see Figure 5.7). These lifetimes can be compared to interhemispheric mixing times of years to intrahemispheric mixing times of months. Water has
the shortest lifetime in the atmosphere (6 to 15 days, from the equator to the polar regions).
Gases such as methane and carbon monoxide that have continental sources have different
distributions between the hemispheres because of their different lifetimes (see Figure 5.8).
The long lifetime of methane (7 years) results in a nearly uniform distribution between
hemispheres. The more reactive carbon monoxide (65 days) is concentrated near its sources
in the north. The slow movement of gases between hemispheres is caused by the intertropical convergence zone (ITCZ). The ITCZ is caused by air rising near the equator. This
prevents mixing across the two hemispheres and results in interhemispheric mixing times
of 1 to 2 yr. The fast intrahemispheric mixing can be demonstrated by following the movement of dust and particles from the El Chichon volcanic eruption in 1982 (see Figure 5.9).
The eruption occurred April 4 and moved completely around the Northern Hemisphere
by April 25.
The concentrations of trace gases in the atmosphere are controlled by a complex combination of processes. Factors that affect the temporal and spatial variability of gases are
the source (strength and variability) and sinks (mechanisms and variability) and lifetime.
The variability close to the sources (polluted air) is dominated by the variations in the
source (automobile traffic), while the variability in remote areas (over the oceans) is controlled by the sinks or lifetimes. The variability of the concentrations of trace gases is
inversely related to the residence time. The concentrations of trace gases in the atmosphere
are higher than would be expected based on thermodynamic calculations. The principal
sources of these gases are
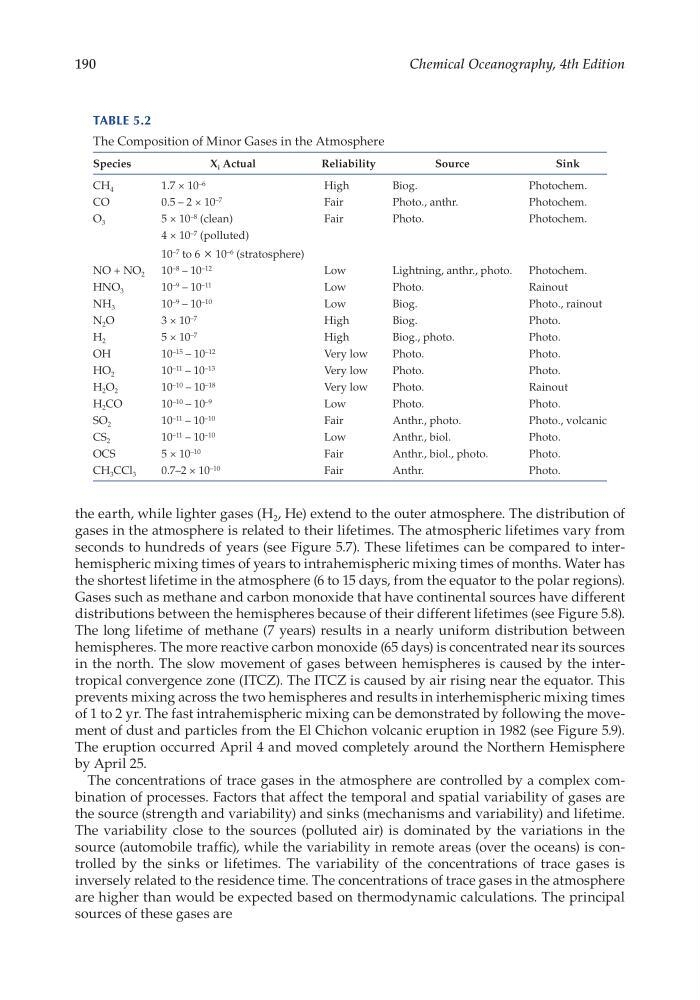
Table 5.2
The Composition of Minor Gases in the Atmosphere
Species
X i Actual
Reliability
Source
Sink
CH 4
1.7 × 10 –6
High
Biog.
Photochem.
CO
0.5 – 2 × 10 –7
Fair
Photo., anthr.
Photochem.
O 3
5 × 10 –8 (clean)
Fair
Photo.
Photochem.
4 × 10 –7 (polluted)
10 –7 to 6 × 10 –6 (stratosphere)
NO + NO 2
10 –8 – 10 –12
Low
Lightning, anthr., photo. Photochem.
HNO 3
10 –9 – 10 –11
Low
Photo.
Rainout
NH 3
10 –9 – 10 –10
Low
Biog.
Photo., rainout
N 2 O
3 × 10 –7
High
Biog.
Photo.
H 2
5 × 10 –7
High
Biog., photo.
Photo.
OH
10 –15 – 10 –12
Very low
Photo.
Photo.
HO 2
10 –11 – 10 –13
Very low
Photo.
Photo.
H 2 O 2
10 –10 – 10 –18
Very low
Photo.
Rainout
H 2 CO
10 –10 – 10 –9
Low
Photo.
Photo.
SO 2
10 –11 – 10 –10
Fair
Anthr., photo.
Photo., volcanic
CS 2
10 –11 – 10 –10
Low
Anthr., biol.
Photo.
OCS
5 × 10 –10
Fair
Anthr., biol., photo.
Photo.
CH 3 CCl 3
0.7–2 × 10 –10
Fair
Anthr.
Photo.
Chemical Oceanography, 4th Edition
the earth, while lighter gases (H 2 , He) extend to the outer atmosphere. The distribution of
gases in the atmosphere is related to their lifetimes. The atmospheric lifetimes vary from
seconds to hundreds of years (see Figure 5.7). These lifetimes can be compared to interhemispheric mixing times of years to intrahemispheric mixing times of months. Water has
the shortest lifetime in the atmosphere (6 to 15 days, from the equator to the polar regions).
Gases such as methane and carbon monoxide that have continental sources have different
distributions between the hemispheres because of their different lifetimes (see Figure 5.8).
The long lifetime of methane (7 years) results in a nearly uniform distribution between
hemispheres. The more reactive carbon monoxide (65 days) is concentrated near its sources
in the north. The slow movement of gases between hemispheres is caused by the intertropical convergence zone (ITCZ). The ITCZ is caused by air rising near the equator. This
prevents mixing across the two hemispheres and results in interhemispheric mixing times
of 1 to 2 yr. The fast intrahemispheric mixing can be demonstrated by following the movement of dust and particles from the El Chichon volcanic eruption in 1982 (see Figure 5.9).
The eruption occurred April 4 and moved completely around the Northern Hemisphere
by April 25.
The concentrations of trace gases in the atmosphere are controlled by a complex combination of processes. Factors that affect the temporal and spatial variability of gases are
the source (strength and variability) and sinks (mechanisms and variability) and lifetime.
The variability close to the sources (polluted air) is dominated by the variations in the
source (automobile traffic), while the variability in remote areas (over the oceans) is controlled by the sinks or lifetimes. The variability of the concentrations of trace gases is
inversely related to the residence time. The concentrations of trace gases in the atmosphere
are higher than would be expected based on thermodynamic calculations. The principal
sources of these gases are
Table 5.2
The Composition of Minor Gases in the Atmosphere
Species
X i Actual
Reliability
Source
Sink
CH 4
1.7 × 10 –6
High
Biog.
Photochem.
CO
0.5 – 2 × 10 –7
Fair
Photo., anthr.
Photochem.
O 3
5 × 10 –8 (clean)
Fair
Photo.
Photochem.
4 × 10 –7 (polluted)
10 –7 to 6 × 10 –6 (stratosphere)
NO + NO 2
10 –8 – 10 –12
Low
Lightning, anthr., photo. Photochem.
HNO 3
10 –9 – 10 –11
Low
Photo.
Rainout
NH 3
10 –9 – 10 –10
Low
Biog.
Photo., rainout
N 2 O
3 × 10 –7
High
Biog.
Photo.
H 2
5 × 10 –7
High
Biog., photo.
Photo.
OH
10 –15 – 10 –12
Very low
Photo.
Photo.
HO 2
10 –11 – 10 –13
Very low
Photo.
Photo.
H 2 O 2
10 –10 – 10 –18
Very low
Photo.
Rainout
H 2 CO
10 –10 – 10 –9
Low
Photo.
Photo.
SO 2
10 –11 – 10 –10
Fair
Anthr., photo.
Photo., volcanic
CS 2
10 –11 – 10 –10
Low
Anthr., biol.
Photo.
OCS
5 × 10 –10
Fair
Anthr., biol., photo.
Photo.
CH 3 CCl 3
0.7–2 × 10 –10
Fair
Anthr.
Photo.