

189
Atmospheric Chemistry
emissions, biomass burning, and oxidation of CH 4 and nonmethane hydrocarbons. The
reaction with OH· accounts for 90 to 95% of the sinks. This decrease cannot be fully
explained as the result of more efficient use of fossil fuels. It may be related to higher
levels of OH· radicals in the atmosphere or possibly caused by the decrease of O 3 in the
stratosphere from the eruption of Mount Pinatubo in June 1991. The decrease in O 3 may
result in an increase in the UV radiation reaching the troposphere and increased production of OH· radicals from the photolysis of O 3 . A number of other factors can influence the
sources and sinks of CO. Further measurements are needed to confirm the downward
trend. It is interesting to note that the decreases of CO 2 , methane, and nitrous oxide also
showed a slowdown in their increase beginning in 1991, while the input of oxygen showed
an increase. Although these results may be caused by independent effects, they point out
how small changes in the conditions in the atmosphere can lead to dramatic changes in
the concentrations of gases.
5.1.1 Composition of the atmosphere
The atmosphere is composed of major gases (N 2 , O 2 , Ar, H 2 O, and CO 2 at mole fractions);
minor gases (Ne, He, CH 4 , and CO at parts per million); and a number of trace gases (O 3 ,
NO, N 2 O, and SO 2 at parts per billion; CCl 2 F 2 , CF 4 , and NH 3 at parts per trillion); and radicals such as OH· as atoms or molecules per cubic centimeter. In addition to gases, the atmosphere also has condensed phases (clouds, aerosols) that contain numerous compounds
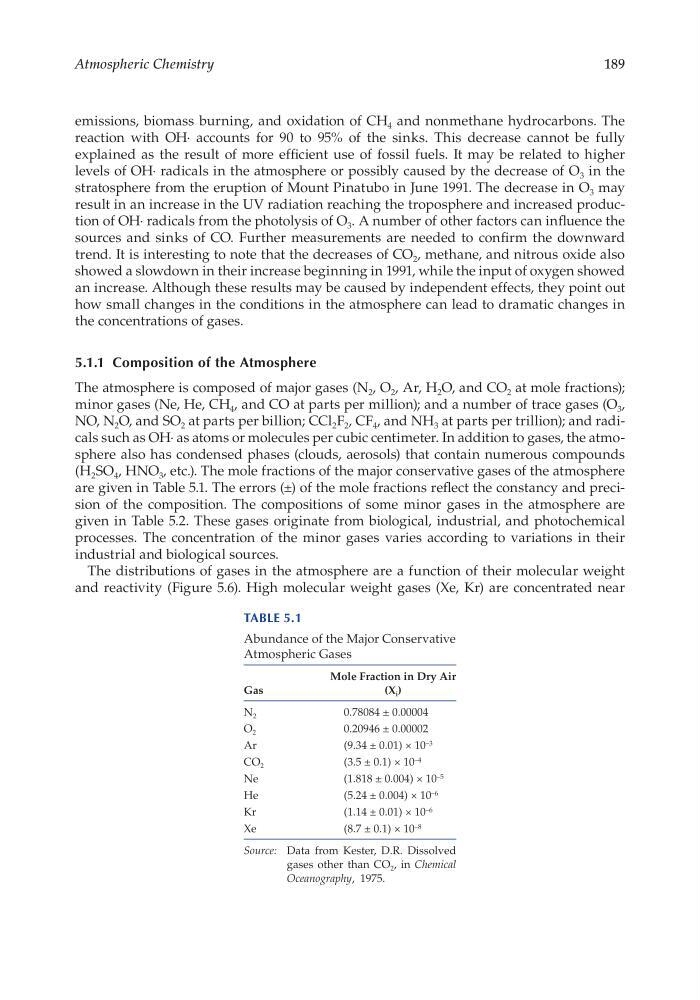
(H 2 SO 4 , HNO 3 , etc.). The mole fractions of the major conservative gases of the atmosphere
are given in Table 5.1. The errors (±) of the mole fractions reflect the constancy and precision of the composition. The compositions of some minor gases in the atmosphere are
given in Table 5.2. These gases originate from biological, industrial, and photochemical
processes. The concentration of the minor gases varies according to variations in their
industrial and biological sources.
The distributions of gases in the atmosphere are a function of their molecular weight
and reactivity (Figure 5.6). High molecular weight gases (Xe, Kr) are concentrated near
Table 5.1
Abundance of the Major Conservative
Atmospheric Gases
Gas
Mole Fraction in Dry Air
(X i )
N 2
0.78084 ± 0.00004
O 2
0.20946 ± 0.00002
Ar
(9.34 ± 0.01) × 10 –3
CO 2
(3.5 ± 0.1) × 10 –4
Ne
(1.818 ± 0.004) × 10 –5
He
(5.24 ± 0.004) × 10 –6
Kr
(1.14 ± 0.01) × 10 –6
Xe
(8.7 ± 0.1) × 10 –8
Source: Data from Kester, D.R. Dissolved
gases other than CO 2 , in Chemical
Oceanography, 1975.
Atmospheric Chemistry
emissions, biomass burning, and oxidation of CH 4 and nonmethane hydrocarbons. The
reaction with OH· accounts for 90 to 95% of the sinks. This decrease cannot be fully
explained as the result of more efficient use of fossil fuels. It may be related to higher
levels of OH· radicals in the atmosphere or possibly caused by the decrease of O 3 in the
stratosphere from the eruption of Mount Pinatubo in June 1991. The decrease in O 3 may
result in an increase in the UV radiation reaching the troposphere and increased production of OH· radicals from the photolysis of O 3 . A number of other factors can influence the
sources and sinks of CO. Further measurements are needed to confirm the downward
trend. It is interesting to note that the decreases of CO 2 , methane, and nitrous oxide also
showed a slowdown in their increase beginning in 1991, while the input of oxygen showed
an increase. Although these results may be caused by independent effects, they point out
how small changes in the conditions in the atmosphere can lead to dramatic changes in
the concentrations of gases.
5.1.1 Composition of the atmosphere
The atmosphere is composed of major gases (N 2 , O 2 , Ar, H 2 O, and CO 2 at mole fractions);
minor gases (Ne, He, CH 4 , and CO at parts per million); and a number of trace gases (O 3 ,
NO, N 2 O, and SO 2 at parts per billion; CCl 2 F 2 , CF 4 , and NH 3 at parts per trillion); and radicals such as OH· as atoms or molecules per cubic centimeter. In addition to gases, the atmosphere also has condensed phases (clouds, aerosols) that contain numerous compounds
(H 2 SO 4 , HNO 3 , etc.). The mole fractions of the major conservative gases of the atmosphere
are given in Table 5.1. The errors (±) of the mole fractions reflect the constancy and precision of the composition. The compositions of some minor gases in the atmosphere are
given in Table 5.2. These gases originate from biological, industrial, and photochemical
processes. The concentration of the minor gases varies according to variations in their
industrial and biological sources.
The distributions of gases in the atmosphere are a function of their molecular weight
and reactivity (Figure 5.6). High molecular weight gases (Xe, Kr) are concentrated near
Table 5.1
Abundance of the Major Conservative
Atmospheric Gases
Gas
Mole Fraction in Dry Air
(X i )
N 2
0.78084 ± 0.00004
O 2
0.20946 ± 0.00002
Ar
(9.34 ± 0.01) × 10 –3
CO 2
(3.5 ± 0.1) × 10 –4
Ne
(1.818 ± 0.004) × 10 –5
He
(5.24 ± 0.004) × 10 –6
Kr
(1.14 ± 0.01) × 10 –6
Xe
(8.7 ± 0.1) × 10 –8
Source: Data from Kester, D.R. Dissolved
gases other than CO 2 , in Chemical
Oceanography, 1975.