

177
Ionic Interactions
1. φ
φ
φ
(
)
(
)
(
)
SW E E
NaCl E E
MgSO
Na Cl
Mg SO
=
+
4
4
2. φ
φ
φ
(
)
(
)
(
)
SW E E
Na SO
E E
MgCl
Na SO
Mg Cl
=
+
4
2
4
2
3. φ
φ
φ
φ
(
)
(
)
(
)
SW E E
NaCl E E
MgSO
E E
Na Cl
Na SO
Mg Cl
=
+
+
4
4
( (
)
(
)
MgCl
E E
MgSO
Mg SO
2
4
4
+
φ
.
Experimentally, it is found that the third summation works best because it considers the
weighted sum of all the possible cation–anion interactions. These plus–minus interactions
represent the major ionic interactions that occur in the mixture. Once the ϕ for the mixture
is estimated, a given physical property can be determined from
P = P o + ϕ e T
(4.95)
where e T is the total equivalent of the ionic components of the mixture. Comparisons of
the measured and calculated densities of seawater using this simple additivity method are
shown in Table 4.14. The calculated values are in good agreement with the measured values. At higher ionic strengths (e.g., brines), the estimates are not as reliable.
These larger errors at higher ionic strengths are related to excess mixing parameters.
These excess mixing properties can be studied by mixing two electrolyte solutions at a
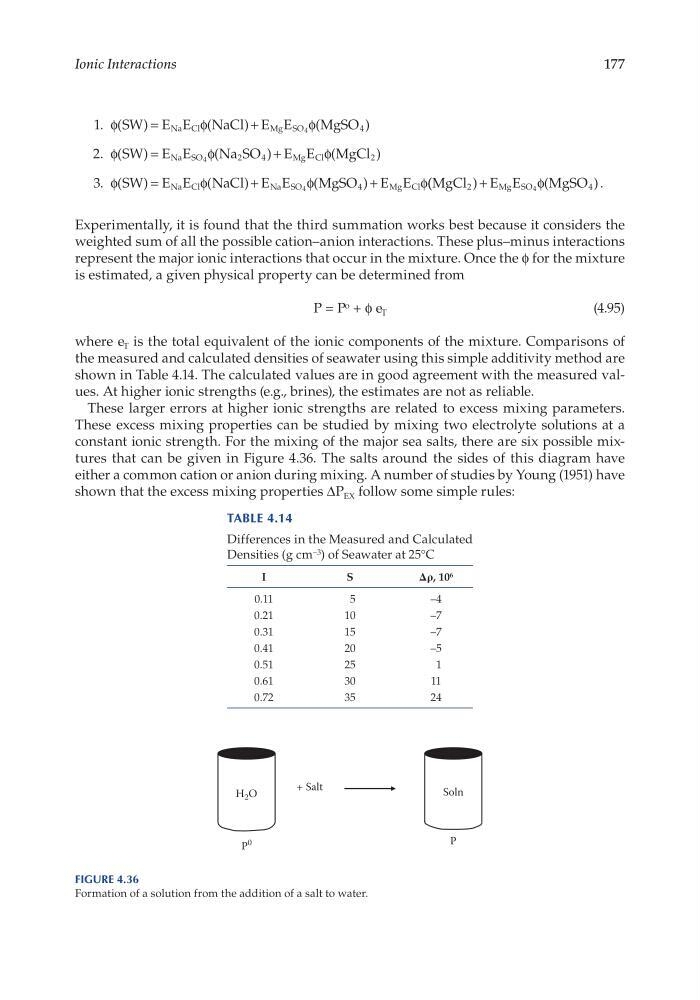
constant ionic strength. For the mixing of the major sea salts, there are six possible mixtures that can be given in Figure 4.36. The salts around the sides of this diagram have
either a common cation or anion during mixing. A number of studies by Young (1951) have
shown that the excess mixing properties ΔP EX follow some simple rules:
H 2 O
+ Salt
Soln
P
0
P
Figure 4.36
Formation of a solution from the addition of a salt to water.
Table 4.14
Differences in the Measured and Calculated
Densities (g cm –3 ) of Seawater at 25°C
I
S
Δρ, 10 6
0.11
5
–4
0.21
10
–7
0.31
15
–7
0.41
20
–5
0.51
25
1
0.61
30
11
0.72
35
24
Ionic Interactions
1. φ
φ
φ
(
)
(
)
(
)
SW E E
NaCl E E
MgSO
Na Cl
Mg SO
=
+
4
4
2. φ
φ
φ
(
)
(
)
(
)
SW E E
Na SO
E E
MgCl
Na SO
Mg Cl
=
+
4
2
4
2
3. φ
φ
φ
φ
(
)
(
)
(
)
SW E E
NaCl E E
MgSO
E E
Na Cl
Na SO
Mg Cl
=
+
+
4
4
( (
)
(
)
MgCl
E E
MgSO
Mg SO
2
4
4
+
φ
.
Experimentally, it is found that the third summation works best because it considers the
weighted sum of all the possible cation–anion interactions. These plus–minus interactions
represent the major ionic interactions that occur in the mixture. Once the ϕ for the mixture
is estimated, a given physical property can be determined from
P = P o + ϕ e T
(4.95)
where e T is the total equivalent of the ionic components of the mixture. Comparisons of
the measured and calculated densities of seawater using this simple additivity method are
shown in Table 4.14. The calculated values are in good agreement with the measured values. At higher ionic strengths (e.g., brines), the estimates are not as reliable.
These larger errors at higher ionic strengths are related to excess mixing parameters.
These excess mixing properties can be studied by mixing two electrolyte solutions at a
constant ionic strength. For the mixing of the major sea salts, there are six possible mixtures that can be given in Figure 4.36. The salts around the sides of this diagram have
either a common cation or anion during mixing. A number of studies by Young (1951) have
shown that the excess mixing properties ΔP EX follow some simple rules:
H 2 O
+ Salt
Soln
P
0
P
Figure 4.36
Formation of a solution from the addition of a salt to water.
Table 4.14
Differences in the Measured and Calculated
Densities (g cm –3 ) of Seawater at 25°C
I
S
Δρ, 10 6
0.11
5
–4
0.21
10
–7
0.31
15
–7
0.41
20
–5
0.51
25
1
0.61
30
11
0.72
35
24