

140
Chemical Oceanography, 4th Edition
The time molecules move (i.e., the time for molecular displacements) is 10 –5 s in ice and
10 –11 s in the liquid. Recent studies have been made by using techniques that can examine
the structure of liquids at very fast rates. These studies are briefly reviewed next.
The structure of water just outlined and discussed more recently (Ohmine and Tanaka,
1993) has received some major interest. The debate on the unique structure of water continues (Soper, 2000; Pratt, 2002). These new studies have used ultrafast probes to study the
structure of water. Ruan et al. (2004) studied thin ice films using laser pulses and measured
the structural change by electron diffraction. Their results show a transient structure of
water on hydrophobic surfaces. The water molecules at the surface appear to be more gaslike than in a three- dimensional network. The work of Wernet et al. (2004) indicates that
water molecules have only two hydrogen bonds (one a donor and the other an acceptor
hydrogen bond). These results do not agree with the earlier accepted view that each water
molecule is involved in three or four hydrogen bonds. They believed that water molecules
in the liquid resemble water on the surface of ice, and that 80% of the water molecules have
only two strong hydrogen bonds on the subfemtosecond (10 –15 -s) timescale. These stronger
hydrogen bonds are surrounded by a cluster of weak hydrogen bonds. The static picture
based on x- ray absorption and neutron diffraction integrates the structure of time, giving
an average picture of the three- dimensional structure in the liquid.
These snapshot pictures of liquid water are not consistent with the structure that comes
from some earlier molecular dynamics simulations. More recent molecular dynamics
studies by Kuo and Mundy (2004) of the liquid–vapor interface were able to reproduce and
quantify the structure of water on interfaces. Their work supports some measurements
(Du et al., 1993; Raymond et al., 2003) that provide proof that water at interfaces has dangling OH bonds, which they called “acceptor- only” hydrogen bonds. These acceptor- only
waters are 19% while the “single- donor” waters are 66% of the waters at the interface.
These studies have changed our ideas of the structure at interfaces. For example, the
hydration of halides (F, Cl, Br, I) is partitioned at the interface. The order of the ions from
the interface is I, Br, Cl, F. The most hydrated species is in the bulk water, while I is close to
the interface. This may be important for the behavior of halides at the interface of aerosols.
τ D (ice)
τ V (water)
Log of Time (sec)
τ D (water, 0°C)
4
2
0
–2
–4
–6
–8
–10
–12
–14
–16
X-ray diffraction
τ S
τ E
NMR Chemical
Shift
ermodynamic
Properties
Dielectric Relaxation
Light Scattering
Inelastic Neutron Scattering
IR and Raman Spectroscopy
Ultrasonic Absorption
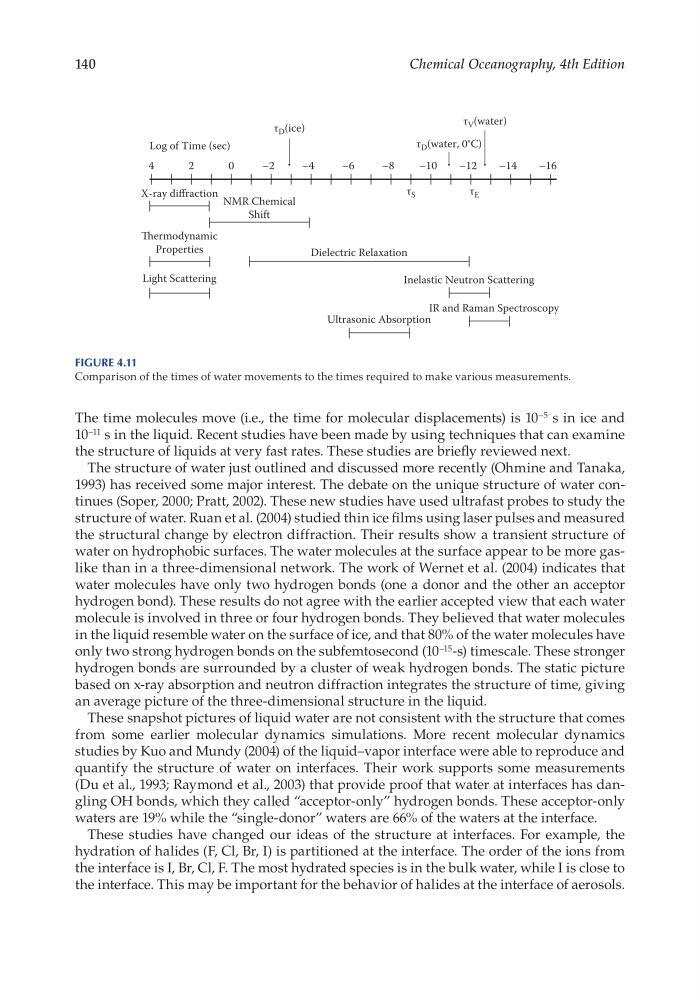
Figure 4.11
Comparison of the times of water movements to the times required to make various measurements.
Chemical Oceanography, 4th Edition
The time molecules move (i.e., the time for molecular displacements) is 10 –5 s in ice and
10 –11 s in the liquid. Recent studies have been made by using techniques that can examine
the structure of liquids at very fast rates. These studies are briefly reviewed next.
The structure of water just outlined and discussed more recently (Ohmine and Tanaka,
1993) has received some major interest. The debate on the unique structure of water continues (Soper, 2000; Pratt, 2002). These new studies have used ultrafast probes to study the
structure of water. Ruan et al. (2004) studied thin ice films using laser pulses and measured
the structural change by electron diffraction. Their results show a transient structure of
water on hydrophobic surfaces. The water molecules at the surface appear to be more gaslike than in a three- dimensional network. The work of Wernet et al. (2004) indicates that
water molecules have only two hydrogen bonds (one a donor and the other an acceptor
hydrogen bond). These results do not agree with the earlier accepted view that each water
molecule is involved in three or four hydrogen bonds. They believed that water molecules
in the liquid resemble water on the surface of ice, and that 80% of the water molecules have
only two strong hydrogen bonds on the subfemtosecond (10 –15 -s) timescale. These stronger
hydrogen bonds are surrounded by a cluster of weak hydrogen bonds. The static picture
based on x- ray absorption and neutron diffraction integrates the structure of time, giving
an average picture of the three- dimensional structure in the liquid.
These snapshot pictures of liquid water are not consistent with the structure that comes
from some earlier molecular dynamics simulations. More recent molecular dynamics
studies by Kuo and Mundy (2004) of the liquid–vapor interface were able to reproduce and
quantify the structure of water on interfaces. Their work supports some measurements
(Du et al., 1993; Raymond et al., 2003) that provide proof that water at interfaces has dangling OH bonds, which they called “acceptor- only” hydrogen bonds. These acceptor- only
waters are 19% while the “single- donor” waters are 66% of the waters at the interface.
These studies have changed our ideas of the structure at interfaces. For example, the
hydration of halides (F, Cl, Br, I) is partitioned at the interface. The order of the ions from
the interface is I, Br, Cl, F. The most hydrated species is in the bulk water, while I is close to
the interface. This may be important for the behavior of halides at the interface of aerosols.
τ D (ice)
τ V (water)
Log of Time (sec)
τ D (water, 0°C)
4
2
0
–2
–4
–6
–8
–10
–12
–14
–16
X-ray diffraction
τ S
τ E
NMR Chemical
Shift
ermodynamic
Properties
Dielectric Relaxation
Light Scattering
Inelastic Neutron Scattering
IR and Raman Spectroscopy
Ultrasonic Absorption
Figure 4.11
Comparison of the times of water movements to the times required to make various measurements.