

The Argo programme (to deploy several thousand
profiling floats) is an outstanding example of what
needs to be done: the production of thousands of
adequate (not perfect or even the best one can do)
measurements worldwide for long periods of time.
A comparatively minor investment in technology
could produce a new generation of such expendable instruments of a variety of types (e.g. of
long-duration expendable moorings and accompanying instruments). These and other possibilities
(e.g. the entire panoply of acoustically based measurements), desperately call out for a systematic
2.1 Global Problems and Global Observations
57
Wunsch
1896
100
1
1
2
2
3
3
4
4
5
80
60
Sunspots
Inches
40
20
0
(a)
50
40
30
20
10
0
1897 1898 1899 1900 1901 1902 1903 1904 1905 1906 1907 1908 1909 1910 1911 1912 1913 1914 1915 1916 1917 1918 1919 1920 1921 1922
10
160
140
120
100
80
60
40
20
0
Inches
Inches
0
–10
–20
13.5
Lake level (m)
13.0
12.5
12.0
11.5
11.0
10.5
10.0
(b)
1900
1910
1920
1930
Year
1940
1950
1960
1970
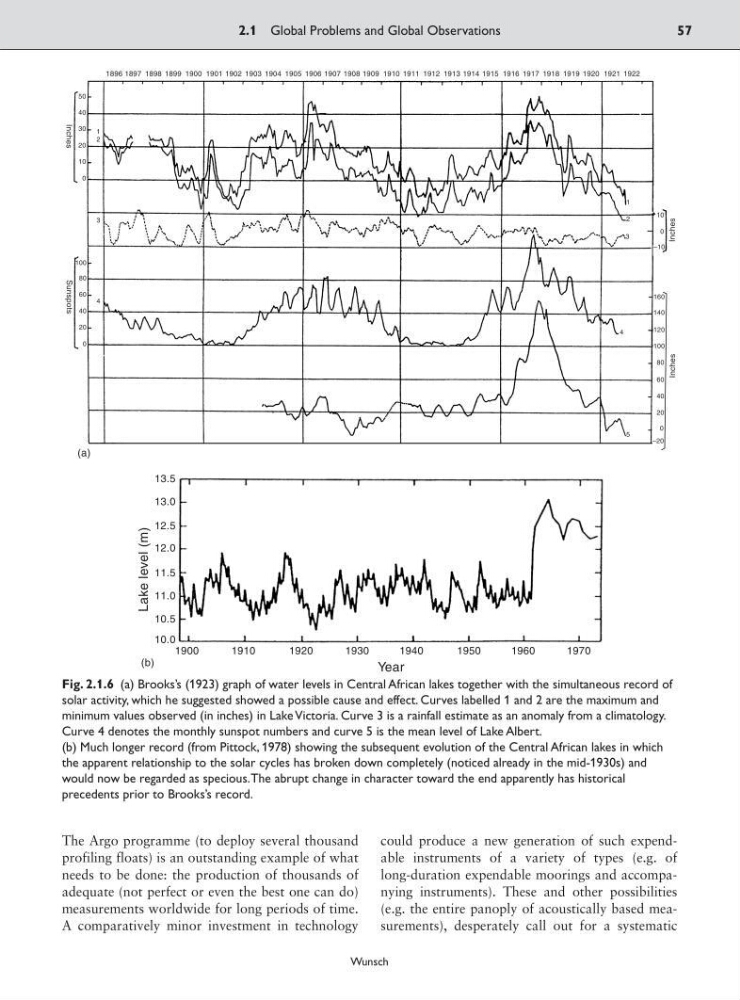
Fig. 2.1.6 (a) Brooks’s (1923) graph of water levels in Central African lakes together with the simultaneous record of
solar activity, which he suggested showed a possible cause and effect. Curves labelled 1 and 2 are the maximum and
minimum values observed (in inches) in Lake Victoria. Curve 3 is a rainfall estimate as an anomaly from a climatology.
Curve 4 denotes the monthly sunspot numbers and curve 5 is the mean level of Lake Albert.
(b) Much longer record (from Pittock, 1978) showing the subsequent evolution of the Central African lakes in which
the apparent relationship to the solar cycles has broken down completely (noticed already in the mid-1930s) and
would now be regarded as specious.The abrupt change in character toward the end apparently has historical
precedents prior to Brooks’s record.
profiling floats) is an outstanding example of what
needs to be done: the production of thousands of
adequate (not perfect or even the best one can do)
measurements worldwide for long periods of time.
A comparatively minor investment in technology
could produce a new generation of such expendable instruments of a variety of types (e.g. of
long-duration expendable moorings and accompanying instruments). These and other possibilities
(e.g. the entire panoply of acoustically based measurements), desperately call out for a systematic
2.1 Global Problems and Global Observations
57
Wunsch
1896
100
1
1
2
2
3
3
4
4
5
80
60
Sunspots
Inches
40
20
0
(a)
50
40
30
20
10
0
1897 1898 1899 1900 1901 1902 1903 1904 1905 1906 1907 1908 1909 1910 1911 1912 1913 1914 1915 1916 1917 1918 1919 1920 1921 1922
10
160
140
120
100
80
60
40
20
0
Inches
Inches
0
–10
–20
13.5
Lake level (m)
13.0
12.5
12.0
11.5
11.0
10.5
10.0
(b)
1900
1910
1920
1930
Year
1940
1950
1960
1970
Fig. 2.1.6 (a) Brooks’s (1923) graph of water levels in Central African lakes together with the simultaneous record of
solar activity, which he suggested showed a possible cause and effect. Curves labelled 1 and 2 are the maximum and
minimum values observed (in inches) in Lake Victoria. Curve 3 is a rainfall estimate as an anomaly from a climatology.
Curve 4 denotes the monthly sunspot numbers and curve 5 is the mean level of Lake Albert.
(b) Much longer record (from Pittock, 1978) showing the subsequent evolution of the Central African lakes in which
the apparent relationship to the solar cycles has broken down completely (noticed already in the mid-1930s) and
would now be regarded as specious.The abrupt change in character toward the end apparently has historical
precedents prior to Brooks’s record.