

available historical data from the 1960s
(Fig. 7.3.14). Running zonally along 47°N, 24°N,
10°N, 17°S, 32°S and 43°S, these sections cover the
subpolar, subtropical and equatorial regions of the
North Pacific, the subtropical gyres of the South
Pacific and Indian Ocean, and the southern
Tasman Sea. These transoceanic sections thus
cover major and distinct oceanographic features of
the global ocean.
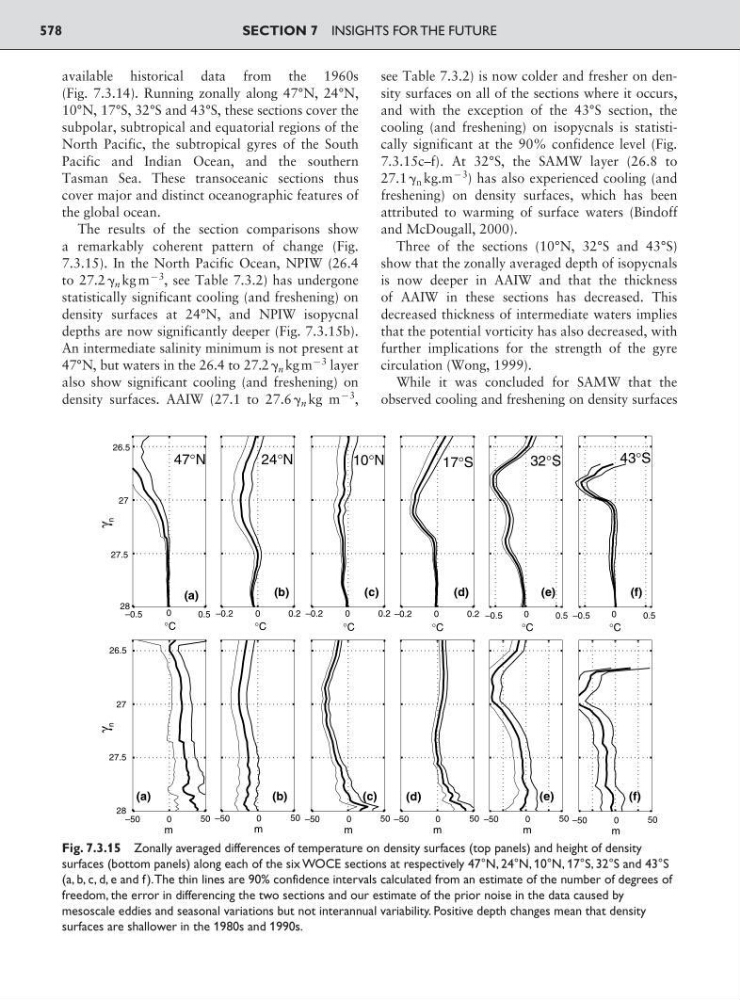
The results of the section comparisons show
a remarkably coherent pattern of change (Fig.
7.3.15). In the North Pacific Ocean, NPIW (26.4
to 27.2 ␥ n kg m
93
, see Table 7.3.2) has undergone
statistically significant cooling (and freshening) on
density surfaces at 24°N, and NPIW isopycnal
depths are now significantly deeper (Fig. 7.3.15b).
An intermediate salinity minimum is not present at
47°N, but waters in the 26.4 to 27.2 ␥ n kg m
93 layer
also show significant cooling (and freshening) on
density surfaces. AAIW (27.1 to 27.6 ␥ n kg m
93
,
see Table 7.3.2) is now colder and fresher on density surfaces on all of the sections where it occurs,
and with the exception of the 43°S section, the
cooling (and freshening) on isopycnals is statistically significant at the 90% confidence level (Fig.
7.3.15c–f). At 32°S, the SAMW layer (26.8 to
27.1 ␥ n kg.m
93
) has also experienced cooling (and
freshening) on density surfaces, which has been
attributed to warming of surface waters (Bindoff
and McDougall, 2000).
Three of the sections (10°N, 32°S and 43°S)
show that the zonally averaged depth of isopycnals
is now deeper in AAIW and that the thickness
of AAIW in these sections has decreased. This
decreased thickness of intermediate waters implies
that the potential vorticity has also decreased, with
further implications for the strength of the gyre
circulation (Wong, 1999).
While it was concluded for SAMW that the
observed cooling and freshening on density surfaces
SECTION 7 INSIGHTS FOR THE FUTURE
578
–0.5
0
0.5
26.5
27
27.5
28
°C
–0.5
0
0.5
°C
–0.5
0
0.5
°C
°C
°C
γ
n
γ
n
(a)
47°N
–0.2
0
0.2 –0.2
0
0.2
°C
–0.2
0
0.2
(b)
24°N
(c)
10°N
(d)
17°S
(e)
32°S
(f)
43°S
–50
0
50
26.5
27
27.5
28
m
–50
0
50
m
–50
0
50
m
–50
0
50
m
–50
0
50
m
–50
0
50
m
(a)
(b)
(c)
(d)
(e)
(f)
Fig. 7.3.15 Zonally averaged differences of temperature on density surfaces (top panels) and height of density
surfaces (bottom panels) along each of the six WOCE sections at respectively 47°N, 24°N, 10°N, 17°S, 32°S and 43°S
(a, b, c, d, e and f).The thin lines are 90% confidence intervals calculated from an estimate of the number of degrees of
freedom, the error in differencing the two sections and our estimate of the prior noise in the data caused by
mesoscale eddies and seasonal variations but not interannual variability. Positive depth changes mean that density
surfaces are shallower in the 1980s and 1990s.