

the method of Bindoff and McDougall (1994),
these changes in SAMW were most simply
explained by the ‘pure warming’ process, consistent with the warming of surface waters south of
Australia and their subsequent subduction; the
‘pure freshening’ process (freshening of the source
waters) was less important.
Johnson and Orsi (1997) later showed that
these changes, first noted in the Tasman Sea, have
a broad geographical distribution. Comparing
repeat occupations of a meridional section along
170°W between 60°S and the Equator in 1968–69
and 1990, and a short zonal section along 35°S
from the dateline to 169°W in 1969 and 1991,
they found a robust cooling (and freshening) on
isopycnals, with peak differences exceeding 91.0°C
(90.25 psu) around the SAMW layer at the base of
the subtropical thermocline, and extending into the
AAIW layer below. More generally they showed
that while this pattern of change on density surfaces in SAMW was strongest in the region south
of Australia, it extended over almost the whole
South Pacific, with the exception of the southeastern region from 100°W to South America (Fig.
7.3.13, see Plate 7.3.13, p. 588).
The apparently contradictory result of warming
(and increased salinity) on density surfaces in this
southeastern region also coincides with the change
from a positive to negative slope in the –S relation.
If Figure 7.3.3b were to have a negative slope (see
also Bindoff and McDougall, 1994), it would show
that warming of surface waters leads to warming
(and increased salinity) on density surfaces in these
circumstances, so that this change remains consistent with the pattern of cooling and freshening on
density surfaces found further to the west. The simplest interpretation of the changes on this density
horizon in SAMW for the whole South Pacific is
that the surface waters feeding this water mass have
been warmed during this ϳ 20-year period.
7.3.9.2 Freshening of NPIW and AAIW
The two intermediate waters, NPIW and AAIW,
which originate respectively in the sub-polar North
Pacific (Warner et al., 1996) and in the Southern
Ocean, have similar roles in ventilating the intermediate depths of the Pacific Ocean. NPIW is of
much smaller volume and is confined to the North
Pacific, while AAIW can be found in the Atlantic,
Indian and Pacific Oceans. Both of these water
masses are characterized by a salinity minimum.
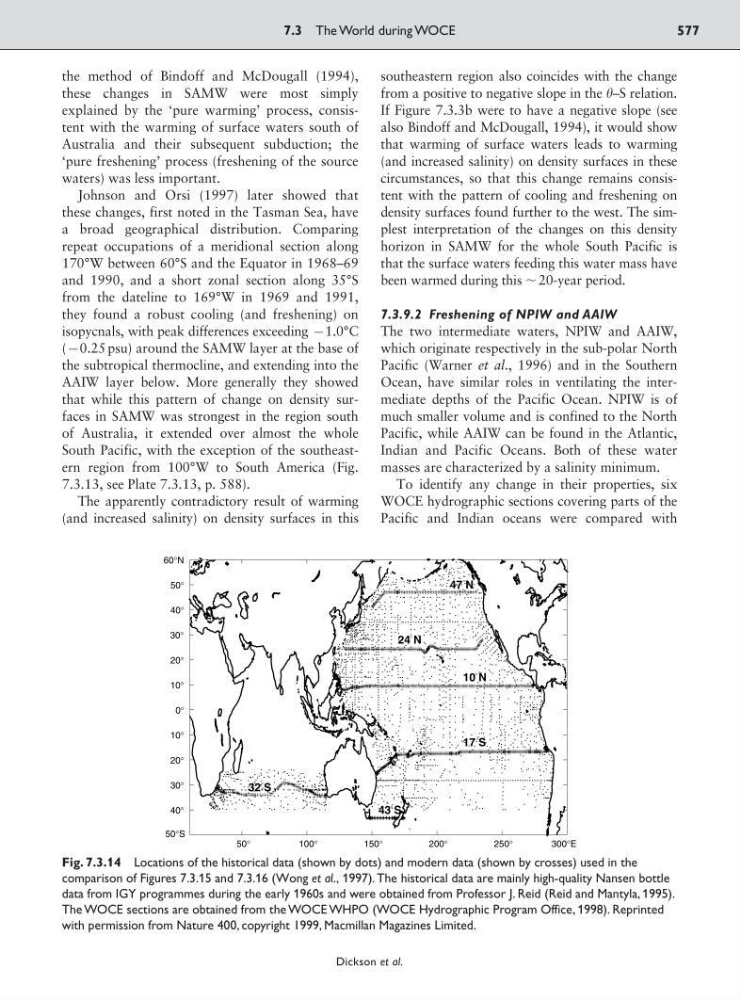
To identify any change in their properties, six
WOCE hydrographic sections covering parts of the
Pacific and Indian oceans were compared with
7.3 The World during WOCE
577
Dickson et al.
50°
100°
150°
200°
250°
300°E
50°S
40°
30°
20°
10°
0°
10°
20°
30°
40°
50°
60°N
32 S
47 N
24 N
10 N
17 S
43 S
°
°
°
°
°
°
Fig. 7.3.14 Locations of the historical data (shown by dots) and modern data (shown by crosses) used in the
comparison of Figures 7.3.15 and 7.3.16 (Wong et al., 1997). The historical data are mainly high-quality Nansen bottle
data from IGY programmes during the early 1960s and were obtained from Professor J. Reid (Reid and Mantyla, 1995).
The WOCE sections are obtained from the WOCE WHPO (WOCE Hydrographic Program Office, 1998). Reprinted
with permission from Nature 400, copyright 1999, Macmillan Magazines Limited.