

7.3.9 Evidence of water mass changes in
the Pacific and Indian Oceans
Here we focus on large-scale changes observed
in three distinct intermediate water masses of
the Pacific and Indian Oceans: Sub-Antarctic
Mode Water (SAMW), Antarctic Intermediate
Water (AAIW) and North Pacific Intermediate
Water (NPIW), all of which are key components of
the thermohaline circulation in these regions. Typically, we compare observations from the 1960s
and 1970s with WOCE hydrographic data from
the late 1980s and early 1990s and are therefore
describing the observed differences over a period
of 20 years or so (Bindoff and Church, 1992;
Johnson and Orsi, 1997; Bindoff and McDougall,
2000; Wong et al., 1999). We have based our
studies on hydrographic data because they provide
concurrent measurements of the two main oceanic
variables: temperature and salinity. As a result we
were able to determine the relative roles of these
two variables in decadal oceanic changes. These
observations are restricted temporally and spatially to the availability of historical hydrographic data. However, even with limited coverage,
comparisons of hydrographic data have shown
remarkable water mass changes that are coherent
on basin-wide scales.
7.3.9.1 Warming of SAMW
Along the 43°S parallel between Australia and
New Zealand, a repeat of the 1967 SCORPIO section by RV Franklin in 1989–90 showed a strong
cooling and freshening signal on density surfaces,
with a downward displacement of isopycnals
(Bindoff and Church, 1992). The cooling and
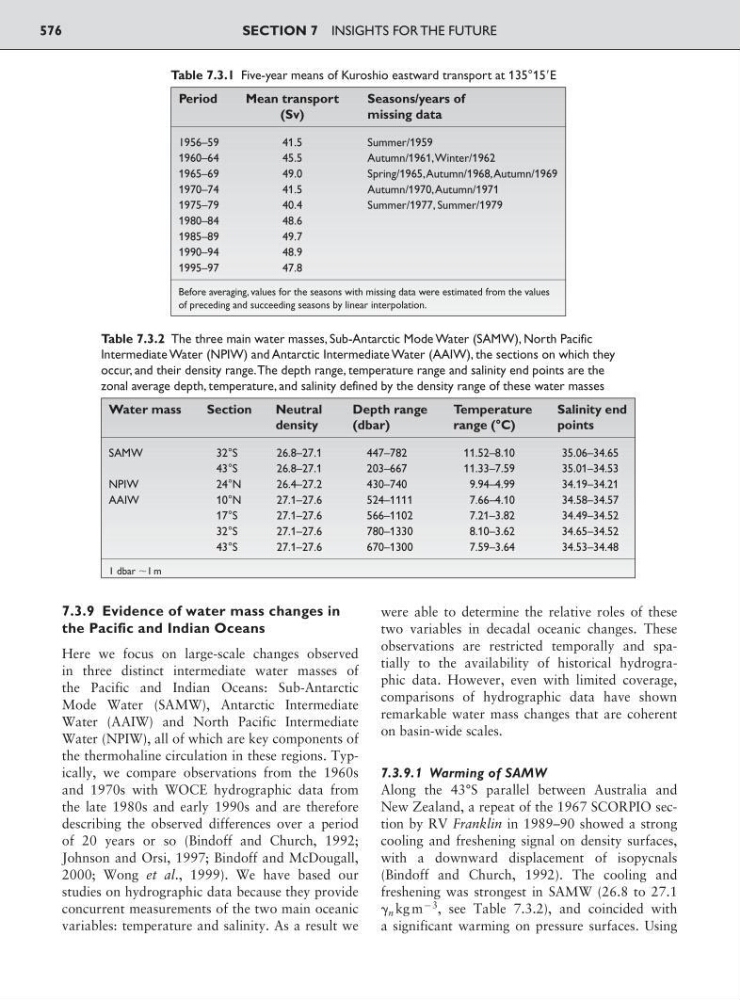
freshening was strongest in SAMW (26.8 to 27.1
␥ n kg m
93
, see Table 7.3.2), and coincided with
a significant warming on pressure surfaces. Using
SECTION 7 INSIGHTS FOR THE FUTURE
576
Table 7.3.1 Five-year means of Kuroshio eastward transport at 135°15ЈE
Period
Mean transport
Seasons/years of
(Sv)
missing data
1956–59
41.5
Summer/1959
1960–64
45.5
Autumn/1961,Winter/1962
1965–69
49.0
Spring/1965,Autumn/1968,Autumn/1969
1970–74
41.5
Autumn/1970,Autumn/1971
1975–79
40.4
Summer/1977, Summer/1979
1980–84
48.6
1985–89
49.7
1990–94
48.9
1995–97
47.8
Before averaging, values for the seasons with missing data were estimated from the values
of preceding and succeeding seasons by linear interpolation.
Table 7.3.2 The three main water masses, Sub-Antarctic Mode Water (SAMW), North Pacific
Intermediate Water (NPIW) and Antarctic Intermediate Water (AAIW), the sections on which they
occur, and their density range.The depth range, temperature range and salinity end points are the
zonal average depth, temperature, and salinity defined by the density range of these water masses
Water mass
Section
Neutral
Depth range
Temperature
Salinity end
density
(dbar)
range (°C)
points
SAMW
32°S
26.8–27.1
447–782
11.52–8.10
35.06–34.65
43°S
26.8–27.1
203–667
11.33–7.59
35.01–34.53
NPIW
24°N
26.4–27.2
430–740
9.94–4.99
34.19–34.21
AAIW
10°N
27.1–27.6
524–1111
7.66–4.10
34.58–34.57
17°S
27.1–27.6
566–1102
7.21–3.82
34.49–34.52
32°S
27.1–27.6
780–1330
8.10–3.62
34.65–34.52
43°S
27.1–27.6
670–1300
7.59–3.64
34.53–34.48
1 dbar ϳ1 m