

and ECMWF. As illustrated, the long-term fluctuations (5-year mean) of Kuroshio transport and
Kuroshio throughflow at 137°E show both similarities and differences: low values in the early
1970s are common to both series, but the slight
upward trend thereafter in ‘Kuroshio’ transport
appears to be maintained through the 1980s into
the 1990s, while that of ‘Kuroshio throughflow’
begins to decline. The Sverdrup transport, inferred
from the wind stress curl field, agrees better with
the transport of the Kuroshio throughflow than
with that of the eastward-flowing Kuroshio
because the latter includes the transport of the
eastward flow associated with the local anticyclonic eddy located on the offshore side of the
Kuroshio (see Fig. 7.3.11).
It is apparent from the 137°E series that the
January and July values are quite different, so that
the slight overall trend may not be well resolved
by this biannual series. However, we can supplement these results with an even longer time series
at twice the resolution. Since 1956, the Kobe
Marine Observatory of JMA has worked hydrographic sections across the Kuroshio at 135°15ЈE
on board the Research Vessel (RV) Shumpu-Maru.
The observations were carried out four times per
year, initially by Nansen bottle, then STD, then
CTD. From this data set, geostrophic velocities
were calculated relative to the 1000 dbar level
and a time series of Kuroshio transport estimates
was then derived by integrating these over the 90mile width covering the strongest part of the
Kuroshio’s eastward flow (Nakamura and Hinata,
1999). If westward flow was encountered in this
90-mile band, the integration was truncated
accordingly.
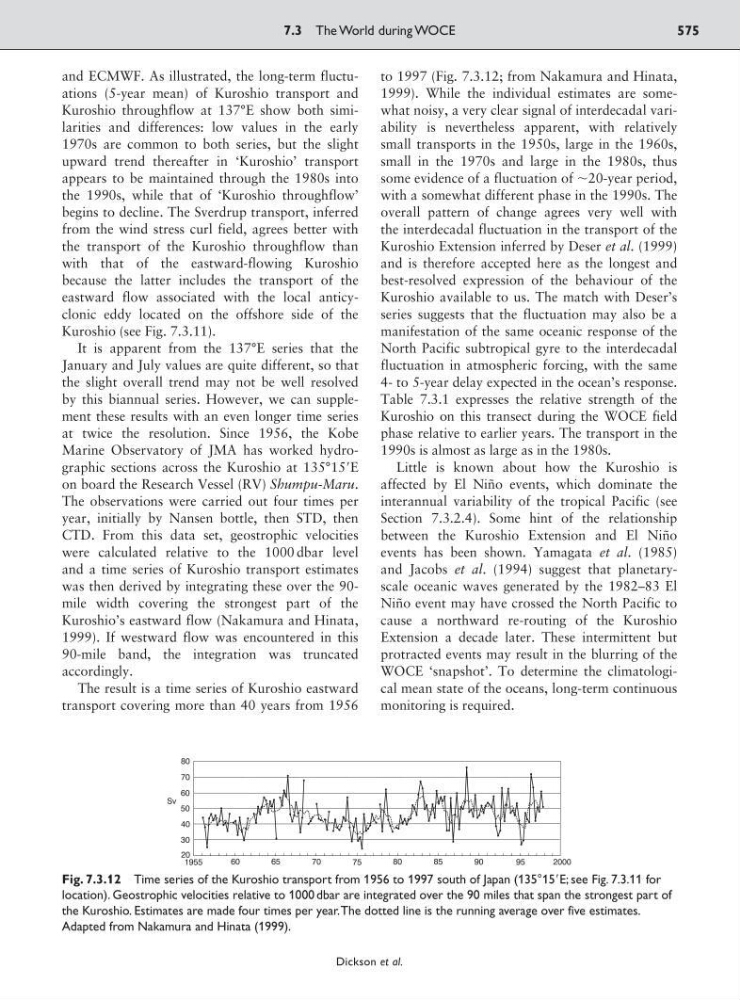
The result is a time series of Kuroshio eastward
transport covering more than 40 years from 1956
to 1997 (Fig. 7.3.12; from Nakamura and Hinata,
1999). While the individual estimates are somewhat noisy, a very clear signal of interdecadal variability is nevertheless apparent, with relatively
small transports in the 1950s, large in the 1960s,
small in the 1970s and large in the 1980s, thus
some evidence of a fluctuation of ϳ20-year period,
with a somewhat different phase in the 1990s. The
overall pattern of change agrees very well with
the interdecadal fluctuation in the transport of the
Kuroshio Extension inferred by Deser et al. (1999)
and is therefore accepted here as the longest and
best-resolved expression of the behaviour of the
Kuroshio available to us. The match with Deser’s
series suggests that the fluctuation may also be a
manifestation of the same oceanic response of the
North Pacific subtropical gyre to the interdecadal
fluctuation in atmospheric forcing, with the same
4- to 5-year delay expected in the ocean’s response.
Table 7.3.1 expresses the relative strength of the
Kuroshio on this transect during the WOCE field
phase relative to earlier years. The transport in the
1990s is almost as large as in the 1980s.
Little is known about how the Kuroshio is
affected by El Niño events, which dominate the
interannual variability of the tropical Pacific (see
Section 7.3.2.4). Some hint of the relationship
between the Kuroshio Extension and El Niño
events has been shown. Yamagata et al. (1985)
and Jacobs et al. (1994) suggest that planetaryscale oceanic waves generated by the 1982–83 El
Niño event may have crossed the North Pacific to
cause a northward re-routing of the Kuroshio
Extension a decade later. These intermittent but
protracted events may result in the blurring of the
WOCE ‘snapshot’. To determine the climatological mean state of the oceans, long-term continuous
monitoring is required.
7.3 The World during WOCE
575
Dickson et al.
Fig. 7.3.12 Time series of the Kuroshio transport from 1956 to 1997 south of Japan (135°15ЈE; see Fig. 7.3.11 for
location). Geostrophic velocities relative to 1000 dbar are integrated over the 90 miles that span the strongest part of
the Kuroshio. Estimates are made four times per year.The dotted line is the running average over five estimates.
Adapted from Nakamura and Hinata (1999).