

37°N. (They note a 4- to 5-year delay between the
decadal scale variation in thermocline depth near
the western boundary and the basin-wide pattern
of wind stress curl.) In the present context, the
question is whether this apparent increase in
Kuroshio transport from the 1970s to the 1980s
was maintained into the period of WOCE. Two
main time series are available to help answer it.
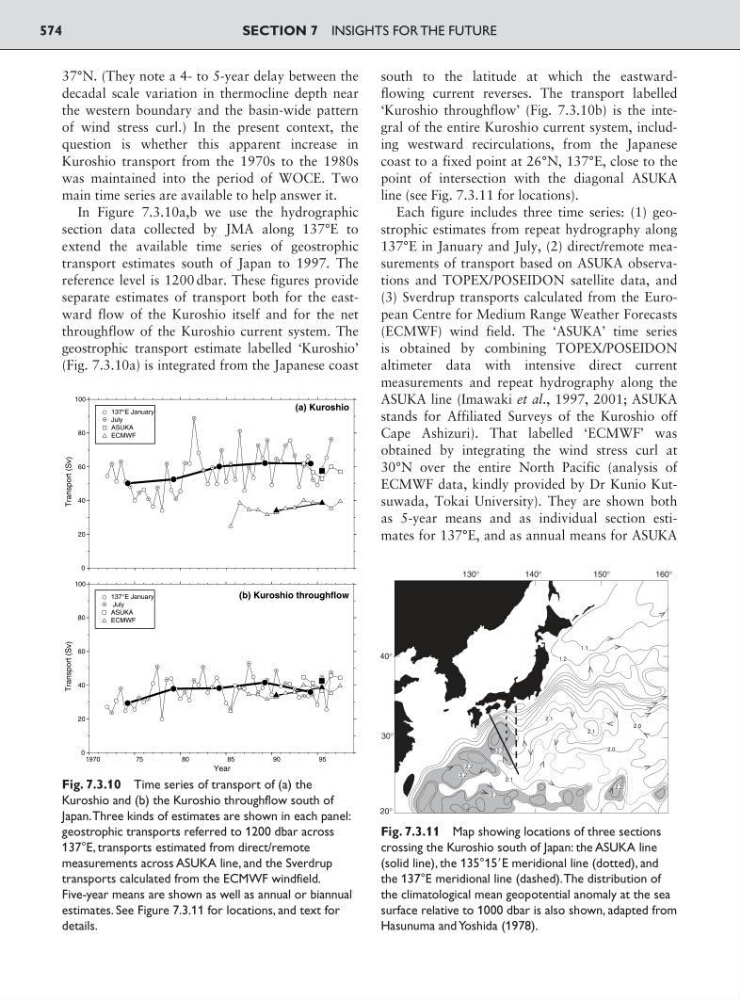
In Figure 7.3.10a,b we use the hydrographic
section data collected by JMA along 137°E to
extend the available time series of geostrophic
transport estimates south of Japan to 1997. The
reference level is 1200 dbar. These figures provide
separate estimates of transport both for the eastward flow of the Kuroshio itself and for the net
throughflow of the Kuroshio current system. The
geostrophic transport estimate labelled ‘Kuroshio’
(Fig. 7.3.10a) is integrated from the Japanese coast
south to the latitude at which the eastwardflowing current reverses. The transport labelled
‘Kuroshio throughflow’ (Fig. 7.3.10b) is the integral of the entire Kuroshio current system, including westward recirculations, from the Japanese
coast to a fixed point at 26°N, 137°E, close to the
point of intersection with the diagonal ASUKA
line (see Fig. 7.3.11 for locations).
Each figure includes three time series: (1) geostrophic estimates from repeat hydrography along
137°E in January and July, (2) direct/remote measurements of transport based on ASUKA observations and TOPEX/POSEIDON satellite data, and
(3) Sverdrup transports calculated from the European Centre for Medium Range Weather Forecasts
(ECMWF) wind field. The ‘ASUKA’ time series
is obtained by combining TOPEX/POSEIDON
altimeter data with intensive direct current
measurements and repeat hydrography along the
ASUKA line (Imawaki et al., 1997, 2001; ASUKA
stands for Affiliated Surveys of the Kuroshio off
Cape Ashizuri). That labelled ‘ECMWF’ was
obtained by integrating the wind stress curl at
30°N over the entire North Pacific (analysis of
ECMWF data, kindly provided by Dr Kunio Kutsuwada, Tokai University). They are shown both
as 5-year means and as individual section estimates for 137°E, and as annual means for ASUKA
SECTION 7 INSIGHTS FOR THE FUTURE
574
(a) Kuroshio
0
20
40
60
80
100
Transport (Sv)
(b) Kuroshio throughflow
0
20
40
60
80
100
Transport (Sv)
1970
75
80
85
90
95
Year
137°E January
July
ASUKA
ECMWF
137°E January
July
ASUKA
ECMWF
Fig. 7.3.10 Time series of transport of (a) the
Kuroshio and (b) the Kuroshio throughflow south of
Japan.Three kinds of estimates are shown in each panel:
geostrophic transports referred to 1200 dbar across
137°E, transports estimated from direct/remote
measurements across ASUKA line, and the Sverdrup
transports calculated from the ECMWF windfield.
Five-year means are shown as well as annual or biannual
estimates. See Figure 7.3.11 for locations, and text for
details.
Fig. 7.3.11 Map showing locations of three sections
crossing the Kuroshio south of Japan: the ASUKA line
(solid line), the 135°15ЈE meridional line (dotted), and
the 137°E meridional line (dashed).The distribution of
the climatological mean geopotential anomaly at the sea
surface relative to 1000 dbar is also shown, adapted from
Hasunuma and Yoshida (1978).