

is most simply explained by the subduction of
warmed surface waters, the interpretation of the
cooling (and freshening) of AAIW and NPIW on
density surfaces is quite different. Both AAIW and
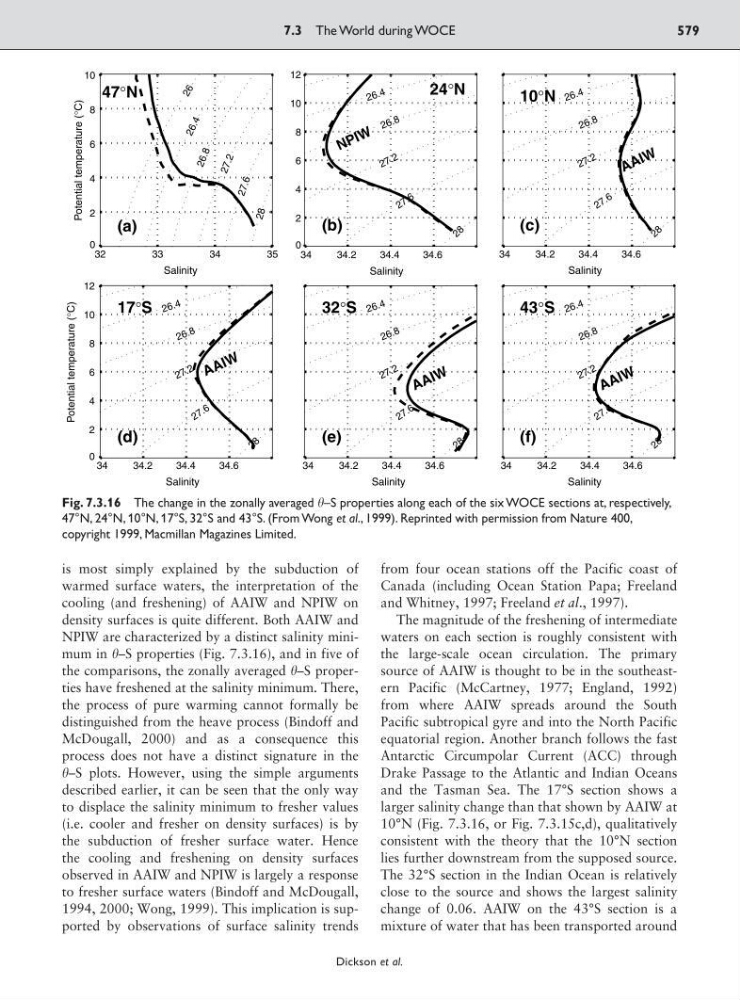
NPIW are characterized by a distinct salinity minimum in –S properties (Fig. 7.3.16), and in five of
the comparisons, the zonally averaged –S properties have freshened at the salinity minimum. There,
the process of pure warming cannot formally be
distinguished from the heave process (Bindoff and
McDougall, 2000) and as a consequence this
process does not have a distinct signature in the
–S plots. However, using the simple arguments
described earlier, it can be seen that the only way
to displace the salinity minimum to fresher values
(i.e. cooler and fresher on density surfaces) is by
the subduction of fresher surface water. Hence
the cooling and freshening on density surfaces
observed in AAIW and NPIW is largely a response
to fresher surface waters (Bindoff and McDougall,
1994, 2000; Wong, 1999). This implication is supported by observations of surface salinity trends
from four ocean stations off the Pacific coast of
Canada (including Ocean Station Papa; Freeland
and Whitney, 1997; Freeland et al., 1997).
The magnitude of the freshening of intermediate
waters on each section is roughly consistent with
the large-scale ocean circulation. The primary
source of AAIW is thought to be in the southeastern Pacific (McCartney, 1977; England, 1992)
from where AAIW spreads around the South
Pacific subtropical gyre and into the North Pacific
equatorial region. Another branch follows the fast
Antarctic Circumpolar Current (ACC) through
Drake Passage to the Atlantic and Indian Oceans
and the Tasman Sea. The 17°S section shows a
larger salinity change than that shown by AAIW at
10°N (Fig. 7.3.16, or Fig. 7.3.15c,d), qualitatively
consistent with the theory that the 10°N section
lies further downstream from the supposed source.
The 32°S section in the Indian Ocean is relatively
close to the source and shows the largest salinity
change of 0.06. AAIW on the 43°S section is a
mixture of water that has been transported around
7.3 The World during WOCE
579
Dickson et al.
32
33
34
35
0
2
4
6
8
10
Salinity
(a)
47°N
2 6 2 6 .4
2 6 .8
2 7 .2 2 7 .6
2 8
34
34.2
34.4
34.6
0
2
4
6
8
10
12
Salinity
N P I W
(b)
24°N
2 6 .4
2 6 .8
2 7 .2
2 7 . 6
2 8
34
34.2
34.4
34.6
Salinity
A A I W
(c)
10°N 2 6 .4
2 6 .8
2 7 .2
2 7 . 6
2 8
34
34.2
34.4
34.6
0
2
4
6
8
10
12
Salinity
Potential temperature (°C)
Potential temperature (°C)
A A I W
(d)
17°S 2 6 .4
2 6 .8
2 7 .2
2 7 . 6
2 8
34
34.2
34.4
34.6
Salinity
A A I W
(e)
32°S 2 6 .4
2 6 .8
2 7 .2
2 7 . 6
2 8
34
34.2
34.4
34.6
Salinity
A A I W
(f)
43°S 2 6 .4
2 6 .8
2 7 .2
2 7 . 6
2 8
Fig. 7.3.16 The change in the zonally averaged –S properties along each of the six WOCE sections at, respectively,
47°N, 24°N, 10°N, 17°S, 32°S and 43°S. (From Wong et al., 1999). Reprinted with permission from Nature 400,
copyright 1999, Macmillan Magazines Limited.