

Lamb et al. (2001) are completing a detailed
cross-over analysis of data collected on different
cruises of the Pacific Ocean WOCE Survey. In this
case, measurements were made by groups from
four countries on 22 WOCE cruises (and several
non-WOCE cruises) using various equipment and
procedures. Preliminary findings of this study are
once again that overall agreement between the
cruises is excellent, although it appears that adjustments to the shipboard data from a few Pacific
cruises will be recommended.
6.3.4 Synthesis of Global CO 2 Survey
data: Review
This section is intended to convey only a flavour
of the type of synthesis that will be forthcoming
over the next several years from the Global CO 2
Survey. To do this I review the existing literature
that has emerged from the Survey, discussing only
papers that deal with results collected on WOCE
cruises. It is important to note that many complementary syntheses are emerging from related
programmes, including the JGOFS and NOAAOACES programmes.
6.3.4.1 Concentration distribution of
Excess CO 2
Preformed-CO 2 methods for Excess CO 2 separation
The oceanic inventory of Excess CO 2 can, in
principle, be calculated directly using so-called
‘preformed-CO 2 ’ methods to separate the Excess
or anthropogenic component from the large and
variable natural background of oceanic dissolved
inorganic carbon. Here I apply the term ‘preformedCO 2 method’ to methods that utilize some form of
back-calculation from observed concentrations to
so-called ‘preformed’ concentrations. Conceptually,
‘preformed’ concentrations refer to concentrations
at water mass surface outcrops at the time of water
mass formation (usually late winter), in the case of
CO 2 these have increased with time.
The underlying principle (Brewer, 1978; Chen
and Millero, 1979), is to correct measured TCO 2
concentrations for changes incurred since a water
mass lost its ability to exchange gases directly with
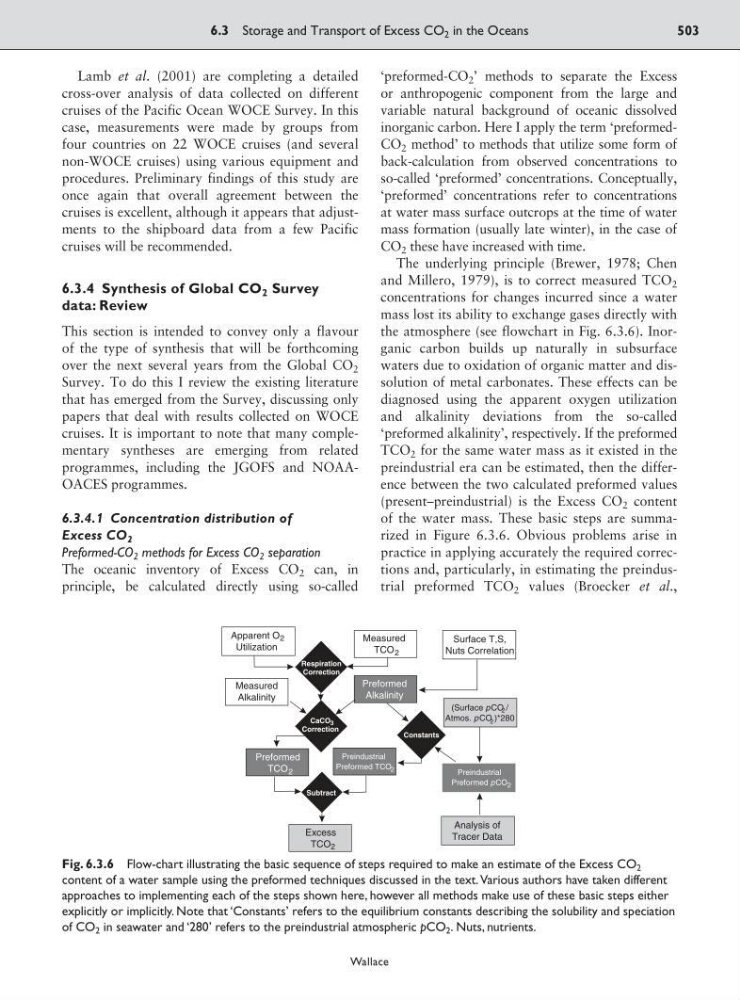
the atmosphere (see flowchart in Fig. 6.3.6). Inorganic carbon builds up naturally in subsurface
waters due to oxidation of organic matter and dissolution of metal carbonates. These effects can be
diagnosed using the apparent oxygen utilization
and alkalinity deviations from the so-called
‘preformed alkalinity’, respectively. If the preformed
TCO 2 for the same water mass as it existed in the
preindustrial era can be estimated, then the difference between the two calculated preformed values
(present–preindustrial) is the Excess CO 2 content
of the water mass. These basic steps are summarized in Figure 6.3.6. Obvious problems arise in
practice in applying accurately the required corrections and, particularly, in estimating the preindustrial preformed TCO 2 values (Broecker et al.,
6.3 Storage and Transport of Excess CO 2 in the Oceans
503
Wallace
Measured
TCO
Preformed
TCO
Preindustrial
Preformed TCO
Preindustrial
Preformed pCO
Preformed
Alkalinity
Excess
TCO
Constants
2
2
2
2
2
2
2
2
3
Apparent O
Utilization
Surface T,S,
Nuts Correlation
Measured
Alkalinity
Analysis of
Tracer Data
(Surface pCO /
Atmos. pCO )*280
Respiration
Correction
CaCO
Correction
Subtract
Fig. 6.3.6 Flow-chart illustrating the basic sequence of steps required to make an estimate of the Excess CO 2
content of a water sample using the preformed techniques discussed in the text. Various authors have taken different
approaches to implementing each of the steps shown here, however all methods make use of these basic steps either
explicitly or implicitly. Note that ‘Constants’ refers to the equilibrium constants describing the solubility and speciation
of CO 2 in seawater and ‘280’ refers to the preindustrial atmospheric pCO 2 . Nuts, nutrients.
cross-over analysis of data collected on different
cruises of the Pacific Ocean WOCE Survey. In this
case, measurements were made by groups from
four countries on 22 WOCE cruises (and several
non-WOCE cruises) using various equipment and
procedures. Preliminary findings of this study are
once again that overall agreement between the
cruises is excellent, although it appears that adjustments to the shipboard data from a few Pacific
cruises will be recommended.
6.3.4 Synthesis of Global CO 2 Survey
data: Review
This section is intended to convey only a flavour
of the type of synthesis that will be forthcoming
over the next several years from the Global CO 2
Survey. To do this I review the existing literature
that has emerged from the Survey, discussing only
papers that deal with results collected on WOCE
cruises. It is important to note that many complementary syntheses are emerging from related
programmes, including the JGOFS and NOAAOACES programmes.
6.3.4.1 Concentration distribution of
Excess CO 2
Preformed-CO 2 methods for Excess CO 2 separation
The oceanic inventory of Excess CO 2 can, in
principle, be calculated directly using so-called
‘preformed-CO 2 ’ methods to separate the Excess
or anthropogenic component from the large and
variable natural background of oceanic dissolved
inorganic carbon. Here I apply the term ‘preformedCO 2 method’ to methods that utilize some form of
back-calculation from observed concentrations to
so-called ‘preformed’ concentrations. Conceptually,
‘preformed’ concentrations refer to concentrations
at water mass surface outcrops at the time of water
mass formation (usually late winter), in the case of
CO 2 these have increased with time.
The underlying principle (Brewer, 1978; Chen
and Millero, 1979), is to correct measured TCO 2
concentrations for changes incurred since a water
mass lost its ability to exchange gases directly with
the atmosphere (see flowchart in Fig. 6.3.6). Inorganic carbon builds up naturally in subsurface
waters due to oxidation of organic matter and dissolution of metal carbonates. These effects can be
diagnosed using the apparent oxygen utilization
and alkalinity deviations from the so-called
‘preformed alkalinity’, respectively. If the preformed
TCO 2 for the same water mass as it existed in the
preindustrial era can be estimated, then the difference between the two calculated preformed values
(present–preindustrial) is the Excess CO 2 content
of the water mass. These basic steps are summarized in Figure 6.3.6. Obvious problems arise in
practice in applying accurately the required corrections and, particularly, in estimating the preindustrial preformed TCO 2 values (Broecker et al.,
6.3 Storage and Transport of Excess CO 2 in the Oceans
503
Wallace
Measured
TCO
Preformed
TCO
Preindustrial
Preformed TCO
Preindustrial
Preformed pCO
Preformed
Alkalinity
Excess
TCO
Constants
2
2
2
2
2
2
2
2
3
Apparent O
Utilization
Surface T,S,
Nuts Correlation
Measured
Alkalinity
Analysis of
Tracer Data
(Surface pCO /
Atmos. pCO )*280
Respiration
Correction
CaCO
Correction
Subtract
Fig. 6.3.6 Flow-chart illustrating the basic sequence of steps required to make an estimate of the Excess CO 2
content of a water sample using the preformed techniques discussed in the text. Various authors have taken different
approaches to implementing each of the steps shown here, however all methods make use of these basic steps either
explicitly or implicitly. Note that ‘Constants’ refers to the equilibrium constants describing the solubility and speciation
of CO 2 in seawater and ‘280’ refers to the preindustrial atmospheric pCO 2 . Nuts, nutrients.