

assessed in this way were always :3 mol kg
91
with a mean absolute difference (leg to leg) of
1.8 mol kg
91
. For total alkalinity, the mean
absolute difference at the cross-overs was 2.4 mol
kg
91 (Millero et al., 1998; Sabine et al., 1999).
This level of agreement is within that expected
from the estimated accuracy and precision of the
individual cruise data sets and no additional corrections to the data are warranted.
SECTION 6 LARGE-SCALE OCEAN TRANSPORTS
502
(a)
(b)
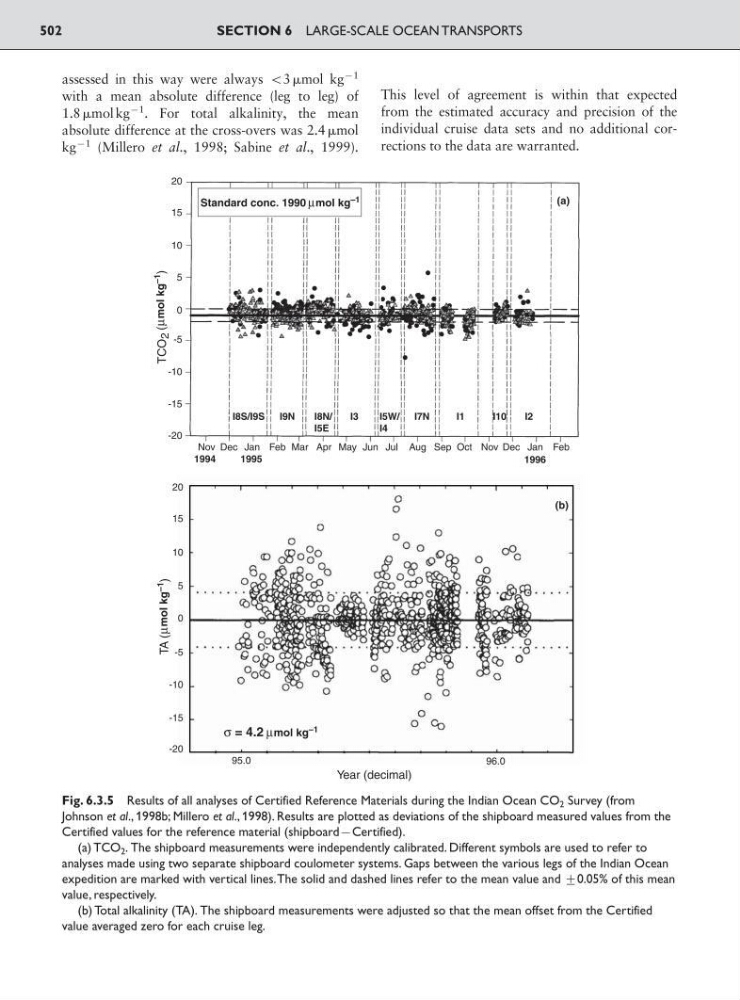
Fig. 6.3.5 Results of all analyses of Certified Reference Materials during the Indian Ocean CO 2 Survey (from
Johnson et al., 1998b; Millero et al., 1998). Results are plotted as deviations of the shipboard measured values from the
Certified values for the reference material (shipboard9Certified).
(a) TCO 2 . The shipboard measurements were independently calibrated. Different symbols are used to refer to
analyses made using two separate shipboard coulometer systems. Gaps between the various legs of the Indian Ocean
expedition are marked with vertical lines.The solid and dashed lines refer to the mean value and <0.05% of this mean
value, respectively.
(b) Total alkalinity (TA). The shipboard measurements were adjusted so that the mean offset from the Certified
value averaged zero for each cruise leg.
91
with a mean absolute difference (leg to leg) of
1.8 mol kg
91
. For total alkalinity, the mean
absolute difference at the cross-overs was 2.4 mol
kg
91 (Millero et al., 1998; Sabine et al., 1999).
This level of agreement is within that expected
from the estimated accuracy and precision of the
individual cruise data sets and no additional corrections to the data are warranted.
SECTION 6 LARGE-SCALE OCEAN TRANSPORTS
502
(a)
(b)
Fig. 6.3.5 Results of all analyses of Certified Reference Materials during the Indian Ocean CO 2 Survey (from
Johnson et al., 1998b; Millero et al., 1998). Results are plotted as deviations of the shipboard measured values from the
Certified values for the reference material (shipboard9Certified).
(a) TCO 2 . The shipboard measurements were independently calibrated. Different symbols are used to refer to
analyses made using two separate shipboard coulometer systems. Gaps between the various legs of the Indian Ocean
expedition are marked with vertical lines.The solid and dashed lines refer to the mean value and <0.05% of this mean
value, respectively.
(b) Total alkalinity (TA). The shipboard measurements were adjusted so that the mean offset from the Certified
value averaged zero for each cruise leg.