

of AAIW concentrated along this boundary, with
an indication of an eastward extension near the
equator. The bifurcation provides evidence against
the hypothesis of a continuous northward western
boundary current south of 20°S, supporting recent
results from float observations (Boebel et al.,
1997). The fact that the CFC (or CFC age) isolines
south of 20°S are virtually zonal indicates that the
supply region of AAIW must also be of a rather
zonal nature. Still, the degree of zonality is surprising, considering that the flow regime is anticyclonic. This feature, which is as yet unexplained, is
also found in the SACW (Roether and Putzka,
1996) and should allow us to examine the specific
roles of recirculation, mixing and ventilation in the
gyre. A surprising finding is that the vertical extension of pure AAIW (Fig. 5.8.10) shows a structure
somewhat similar to that of Figure 5.8.12, although
Figure 5.8.10 is entirely independent of any tracer
data. If this correspondence is real, it means that
AAIW thins vertically as it ages.
The AAIW formation rate was estimated by
means of a CFC balance using a simple box model
(Fig. 5.8.13). The centre box conceptually represents the volume of pure AAIW, coast to coast
between 48 and 18°S, and the southern box represents a supply region. Advective loss occurs
through the western boundary region north of
18°S. The time-dependent CFC concentration in
the source box was chosen to match observations,
and the concentrations in the waters leaving the
centre box in the northwest were fixed by prescribing a delay amounting to the corresponding
age difference according to Figure 5.8.12b. Additionally a diffusive CFC input across the southern
boundary of the centre box was accounted for.
The tracer balance yielded a rate of advective
AAIW renewal of 6.8 <1.4 Sv (for both CFC-11
and CFC-12). Without the correction for mixing,
the value would be about 10% higher. The major
error contributions are (i) the uncertainty of the
total CFC content of the centre box, largely due to
the mentioned correction for the SACW contribution, and (ii) the CFC time curve in the source box
(for details, see Rose, 1999). The deduced rate
should be considered an average over the period of
CFC invasion. It compares rather well with earlier
results (e.g. Rintoul, 1991). In those studies AAIW
is usually defined as the water between selected
isopycnals, and error estimates are missing. The
study of Rose (1999) shows that tracer data provide useful information on the structure of subsurface water masses, and can be used to obtain
robust formation rates, quite independently of
other methods. The specific approach applied may
well be similarly applicable for the study of other
intermediate water masses in the ocean.
5.8.3.4 Mid-depth circulation in the Pacific
inferred from
3 He data
Submarine hydrothermal fluids that are injected
into the oceans from deep sea spreading ridges and
from certain active seamounts contain high
concentrations of mantle helium. The
3
He/
4
He
ratio of this helium is 8–30 times enriched relative
to atmospheric helium (
3
He/
4
He:1.410
96 in
air,
3
He/
4
He:1–410
95 in submarine hydrothermal fluids). Typical hydrothermal fluids have
3
He
concentrations ranging from 0.210
99 to 2.5
10
99 cm
3 STP g
91 (STP, Standard Temperature
SECTION 5 FORMATION AND TRANSPORT OF WATER MASSES
440
–25
–25.5
–26
–26.5
–27
–27.5
–28 0
50
100
150
200
250
300
CFC-11 (pptV)
30°S
30°S
11°S
11°S
σ
0 (kg m
–3
)
σ
0 (kg m
–3
)
–26.2
–26.4
–26.6
–26.8
–27
–27.2
–27.4
–27.6
–27.8
34.2 34.4 34.6
34.8 35 35.2 35.4
35.6 35.8 36
Salinity (PSU)
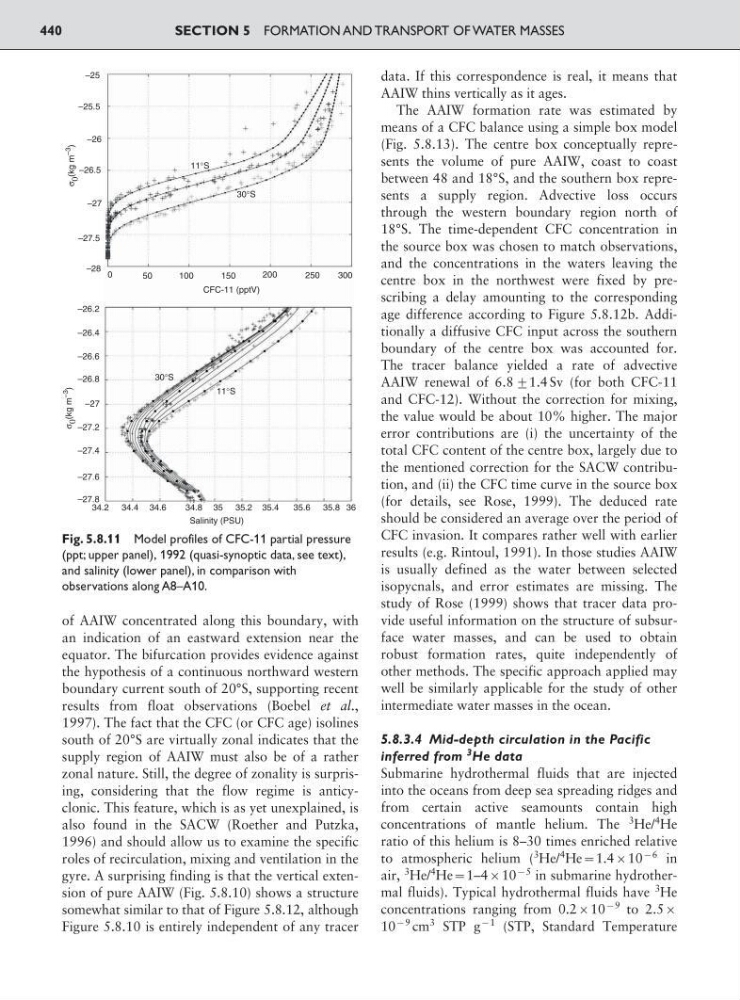
Fig. 5.8.11 Model profiles of CFC-11 partial pressure
(ppt; upper panel), 1992 (quasi-synoptic data, see text),
and salinity (lower panel), in comparison with
observations along A8–A10.
an indication of an eastward extension near the
equator. The bifurcation provides evidence against
the hypothesis of a continuous northward western
boundary current south of 20°S, supporting recent
results from float observations (Boebel et al.,
1997). The fact that the CFC (or CFC age) isolines
south of 20°S are virtually zonal indicates that the
supply region of AAIW must also be of a rather
zonal nature. Still, the degree of zonality is surprising, considering that the flow regime is anticyclonic. This feature, which is as yet unexplained, is
also found in the SACW (Roether and Putzka,
1996) and should allow us to examine the specific
roles of recirculation, mixing and ventilation in the
gyre. A surprising finding is that the vertical extension of pure AAIW (Fig. 5.8.10) shows a structure
somewhat similar to that of Figure 5.8.12, although
Figure 5.8.10 is entirely independent of any tracer
data. If this correspondence is real, it means that
AAIW thins vertically as it ages.
The AAIW formation rate was estimated by
means of a CFC balance using a simple box model
(Fig. 5.8.13). The centre box conceptually represents the volume of pure AAIW, coast to coast
between 48 and 18°S, and the southern box represents a supply region. Advective loss occurs
through the western boundary region north of
18°S. The time-dependent CFC concentration in
the source box was chosen to match observations,
and the concentrations in the waters leaving the
centre box in the northwest were fixed by prescribing a delay amounting to the corresponding
age difference according to Figure 5.8.12b. Additionally a diffusive CFC input across the southern
boundary of the centre box was accounted for.
The tracer balance yielded a rate of advective
AAIW renewal of 6.8 <1.4 Sv (for both CFC-11
and CFC-12). Without the correction for mixing,
the value would be about 10% higher. The major
error contributions are (i) the uncertainty of the
total CFC content of the centre box, largely due to
the mentioned correction for the SACW contribution, and (ii) the CFC time curve in the source box
(for details, see Rose, 1999). The deduced rate
should be considered an average over the period of
CFC invasion. It compares rather well with earlier
results (e.g. Rintoul, 1991). In those studies AAIW
is usually defined as the water between selected
isopycnals, and error estimates are missing. The
study of Rose (1999) shows that tracer data provide useful information on the structure of subsurface water masses, and can be used to obtain
robust formation rates, quite independently of
other methods. The specific approach applied may
well be similarly applicable for the study of other
intermediate water masses in the ocean.
5.8.3.4 Mid-depth circulation in the Pacific
inferred from
3 He data
Submarine hydrothermal fluids that are injected
into the oceans from deep sea spreading ridges and
from certain active seamounts contain high
concentrations of mantle helium. The
3
He/
4
He
ratio of this helium is 8–30 times enriched relative
to atmospheric helium (
3
He/
4
He:1.410
96 in
air,
3
He/
4
He:1–410
95 in submarine hydrothermal fluids). Typical hydrothermal fluids have
3
He
concentrations ranging from 0.210
99 to 2.5
10
99 cm
3 STP g
91 (STP, Standard Temperature
SECTION 5 FORMATION AND TRANSPORT OF WATER MASSES
440
–25
–25.5
–26
–26.5
–27
–27.5
–28 0
50
100
150
200
250
300
CFC-11 (pptV)
30°S
30°S
11°S
11°S
σ
0 (kg m
–3
)
σ
0 (kg m
–3
)
–26.2
–26.4
–26.6
–26.8
–27
–27.2
–27.4
–27.6
–27.8
34.2 34.4 34.6
34.8 35 35.2 35.4
35.6 35.8 36
Salinity (PSU)
Fig. 5.8.11 Model profiles of CFC-11 partial pressure
(ppt; upper panel), 1992 (quasi-synoptic data, see text),
and salinity (lower panel), in comparison with
observations along A8–A10.