

towards higher concentrations in the SACW, while
the underlying uCDW is virtually CFC-free. The
resulting net CFC addition from the SACW by
vertical mixing was corrected for by means of an
advection-mixing model, which accounts for onedimensional, isopycnal south-to-north advection
and mixing, as well as for diapycnal mixing, with
prescribed concentrations at the respective outcrops. The model parameters were chosen to reproduce CFCs and salinity along WHP sections A8 to
A10 (Fig. 5.8.11).
Figure 5.8.12 shows the resulting CFC-11 distribution (Fig. 5.8.12a) and CFC-11 concentration
ages (Fig. 5.8.12b) in the core layer of pure AAIW.
The apparent ages in Fig. 5.8.12b increase from a
few years south of 50°S up to more than 40 years
in the centre of the northern cyclonic gyre (Angola
Dome). In keeping with Warner and Weiss (1992),
a strong north–south gradient centred at about
20°S is evident, which extends into a bifurcation at
the western boundary. The northward arm of the
bifurcation feeds a pronounced northward tongue
5.8 Transformation and Age of Water Masses
439
Schlosser et al.
Zonal 30°S Meteor 22/5
Zonal 19°S Meteor 15
Zonal 11°S Meteor 28/2
Depth (m)
Depth (m)
Depth (m)
0
–500
–1000
–1500
–500
–1000
–1500
–500
–1000
–1500
0
0
0
50
100
0
50
100
0
50
100
–26.8
–27
–27.2
–27.4
–27.6
–26.8
–27
–27.2
–27.4
–27.6
–27.8
–27
–27.2
–27.4
–27.6
0
50
100
0
50
100
0
50
100
Quantity of pure AAIW (%)
Quantity of pure AAIW (%)
Quantity of pure AAIW (%)
Quantity of pure AAIW (%)
Quantity of pure AAIW (%)
Quantity of pure AAIW (%)
σ
0 (kg m –3
)
σ
0 (kg m –3
)
σ
0 (kg m –3
)
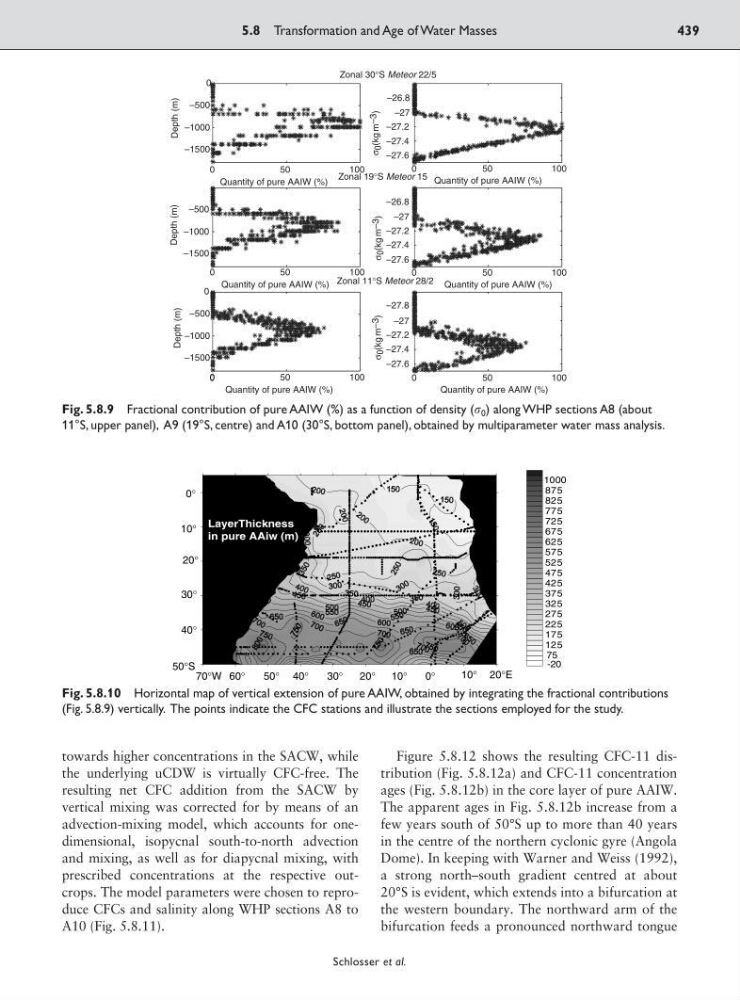
Fig. 5.8.9 Fractional contribution of pure AAIW (%) as a function of density ( 0 ) along WHP sections A8 (about
11°S, upper panel), A9 (19°S, centre) and A10 (30°S, bottom panel), obtained by multiparameter water mass analysis.
-20
75
125
175
225
275
325
375
425
475
525
575
625
675
725
775
825
875
1000
70°W 60°
50° 40°
30°
10°
20°
0°
0°
10°
20°
30°
40°
50°S
10° 20°E
LayerThickness
in pure AAiw (m)
Fig. 5.8.10 Horizontal map of vertical extension of pure AAIW, obtained by integrating the fractional contributions
(Fig. 5.8.9) vertically. The points indicate the CFC stations and illustrate the sections employed for the study.
the underlying uCDW is virtually CFC-free. The
resulting net CFC addition from the SACW by
vertical mixing was corrected for by means of an
advection-mixing model, which accounts for onedimensional, isopycnal south-to-north advection
and mixing, as well as for diapycnal mixing, with
prescribed concentrations at the respective outcrops. The model parameters were chosen to reproduce CFCs and salinity along WHP sections A8 to
A10 (Fig. 5.8.11).
Figure 5.8.12 shows the resulting CFC-11 distribution (Fig. 5.8.12a) and CFC-11 concentration
ages (Fig. 5.8.12b) in the core layer of pure AAIW.
The apparent ages in Fig. 5.8.12b increase from a
few years south of 50°S up to more than 40 years
in the centre of the northern cyclonic gyre (Angola
Dome). In keeping with Warner and Weiss (1992),
a strong north–south gradient centred at about
20°S is evident, which extends into a bifurcation at
the western boundary. The northward arm of the
bifurcation feeds a pronounced northward tongue
5.8 Transformation and Age of Water Masses
439
Schlosser et al.
Zonal 30°S Meteor 22/5
Zonal 19°S Meteor 15
Zonal 11°S Meteor 28/2
Depth (m)
Depth (m)
Depth (m)
0
–500
–1000
–1500
–500
–1000
–1500
–500
–1000
–1500
0
0
0
50
100
0
50
100
0
50
100
–26.8
–27
–27.2
–27.4
–27.6
–26.8
–27
–27.2
–27.4
–27.6
–27.8
–27
–27.2
–27.4
–27.6
0
50
100
0
50
100
0
50
100
Quantity of pure AAIW (%)
Quantity of pure AAIW (%)
Quantity of pure AAIW (%)
Quantity of pure AAIW (%)
Quantity of pure AAIW (%)
Quantity of pure AAIW (%)
σ
0 (kg m –3
)
σ
0 (kg m –3
)
σ
0 (kg m –3
)
Fig. 5.8.9 Fractional contribution of pure AAIW (%) as a function of density ( 0 ) along WHP sections A8 (about
11°S, upper panel), A9 (19°S, centre) and A10 (30°S, bottom panel), obtained by multiparameter water mass analysis.
-20
75
125
175
225
275
325
375
425
475
525
575
625
675
725
775
825
875
1000
70°W 60°
50° 40°
30°
10°
20°
0°
0°
10°
20°
30°
40°
50°S
10° 20°E
LayerThickness
in pure AAiw (m)
Fig. 5.8.10 Horizontal map of vertical extension of pure AAIW, obtained by integrating the fractional contributions
(Fig. 5.8.9) vertically. The points indicate the CFC stations and illustrate the sections employed for the study.