

The subject has been reviewed by Pratt and
Lundberg (1991) and by Whitehead (1998) and is
complex, with solutions only found for a stratified
ocean that is represented by reduced gravity or
two-layered models. Utilizing the simplest of these
solutions, which assumes zero upstream potential
vorticity, Whitehead (1998) has predicted the discharge through straits, over sills and through deep
gaps. The results depend on four parameters:
g⌬/, reduced gravity; h, the upstream height
over the sill; W, the width of the channel at the
sill; and f, the Coriolis parameter. For both the
northern overflows the width is greater than
the Rossby radius, given by the expression R
2
:
2g⌬h/f
2 , and the discharge is
Q:g⌬h
2 /2f
The upstream height, measured above the sill, is
that at which the ocean no longer appears to participate in the overflow process; the isopycnals are
horizontal above this height. The values selected
for all the parameters along with the resulting predicted discharges are seen in Table 5.6.4. Overprediction is found and is expected, since the theory is
an upper limit on the flow and ignores turbulent
mixing, friction and assumes a rectangular shape
to the channel. Borenäs and Lundberg (1988)
showed that for the Faroe Bank Channel a more
reasonable shape, namely parabolic, led to a
reduction of the discharge by about 30%.
Because of conservation of potential vorticity,
in the heart of the channel the cross-stream shear
becomes comparable to f, say 1.25 m s
91 per 10 km
at 60°N, and observations show this to be unrealistically large. If non-zero potential vorticity is
assumed the upstream flow may become confined
to a boundary layer and its details may dominate
the solution (Killworth, 1995). Yet another difficulty is that h, the effective depth of the sill, is a
property of the observed flow, i.e. the solution
itself, and is not an external parameter. The way
forward is not clear.
Analytical models have also been used to predict
the path of the overflow, notably those of Smith
(1975) and Baringer and Price (1990). These termed
‘streamtube’ or ‘plume’ models describe integral
properties of the flow and employ momentum, continuity and density conservation equations. Smith
(1975) found solutions for the Denmark Strait
Overflow that depended on two parameters, a bottom drag coefficient and an entrainment parameter,
both of which were assumed constant. Values of
bottom slope, gravitational acceleration, Coriolis
parameter and overflow initial conditions were also
5.6 The Dense Northern Overflows
413
Saunders
600
400
200
0
-1.0
0.0
1.0
f *E(f )
INSHORE
-1.0
0.0
1.0
OFFSHORE
0
12
24
36
DOHRN BANK
240
160
80
0
-1.0
0.0
1.0
INSHORE
TTO
OFFSHORE
48
32
16
0
-1.0
0.0
1.0
log 10 freq (cpd)
log 10 freq (cpd)
680
1080
2180
2200
940
1142
2638
2738
90
60
30
0
-1.0
0.0
1.0
0
30
60
90
-1.0
0.0
1.0
ANGMAGSSALIK
INSHORE
OFFSHORE
log 10 freq (cpd)
2431
2756
919
1220
2
(cm s )
–2
f *E(f )
2
(cm s )
–2
f *E(f )
2
(cm s )
–2
(a)
(b)
(c)
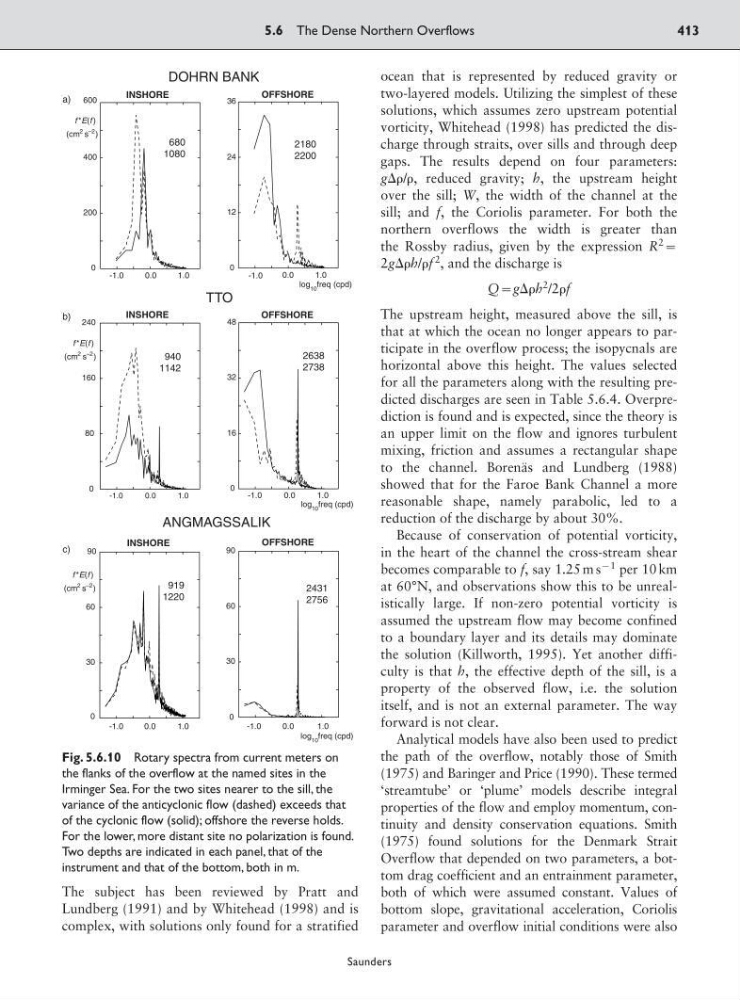
Fig. 5.6.10 Rotary spectra from current meters on
the flanks of the overflow at the named sites in the
Irminger Sea. For the two sites nearer to the sill, the
variance of the anticyclonic flow (dashed) exceeds that
of the cyclonic flow (solid); offshore the reverse holds.
For the lower, more distant site no polarization is found.
Two depths are indicated in each panel, that of the
instrument and that of the bottom, both in m.
Lundberg (1991) and by Whitehead (1998) and is
complex, with solutions only found for a stratified
ocean that is represented by reduced gravity or
two-layered models. Utilizing the simplest of these
solutions, which assumes zero upstream potential
vorticity, Whitehead (1998) has predicted the discharge through straits, over sills and through deep
gaps. The results depend on four parameters:
g⌬/, reduced gravity; h, the upstream height
over the sill; W, the width of the channel at the
sill; and f, the Coriolis parameter. For both the
northern overflows the width is greater than
the Rossby radius, given by the expression R
2
:
2g⌬h/f
2 , and the discharge is
Q:g⌬h
2 /2f
The upstream height, measured above the sill, is
that at which the ocean no longer appears to participate in the overflow process; the isopycnals are
horizontal above this height. The values selected
for all the parameters along with the resulting predicted discharges are seen in Table 5.6.4. Overprediction is found and is expected, since the theory is
an upper limit on the flow and ignores turbulent
mixing, friction and assumes a rectangular shape
to the channel. Borenäs and Lundberg (1988)
showed that for the Faroe Bank Channel a more
reasonable shape, namely parabolic, led to a
reduction of the discharge by about 30%.
Because of conservation of potential vorticity,
in the heart of the channel the cross-stream shear
becomes comparable to f, say 1.25 m s
91 per 10 km
at 60°N, and observations show this to be unrealistically large. If non-zero potential vorticity is
assumed the upstream flow may become confined
to a boundary layer and its details may dominate
the solution (Killworth, 1995). Yet another difficulty is that h, the effective depth of the sill, is a
property of the observed flow, i.e. the solution
itself, and is not an external parameter. The way
forward is not clear.
Analytical models have also been used to predict
the path of the overflow, notably those of Smith
(1975) and Baringer and Price (1990). These termed
‘streamtube’ or ‘plume’ models describe integral
properties of the flow and employ momentum, continuity and density conservation equations. Smith
(1975) found solutions for the Denmark Strait
Overflow that depended on two parameters, a bottom drag coefficient and an entrainment parameter,
both of which were assumed constant. Values of
bottom slope, gravitational acceleration, Coriolis
parameter and overflow initial conditions were also
5.6 The Dense Northern Overflows
413
Saunders
600
400
200
0
-1.0
0.0
1.0
f *E(f )
INSHORE
-1.0
0.0
1.0
OFFSHORE
0
12
24
36
DOHRN BANK
240
160
80
0
-1.0
0.0
1.0
INSHORE
TTO
OFFSHORE
48
32
16
0
-1.0
0.0
1.0
log 10 freq (cpd)
log 10 freq (cpd)
680
1080
2180
2200
940
1142
2638
2738
90
60
30
0
-1.0
0.0
1.0
0
30
60
90
-1.0
0.0
1.0
ANGMAGSSALIK
INSHORE
OFFSHORE
log 10 freq (cpd)
2431
2756
919
1220
2
(cm s )
–2
f *E(f )
2
(cm s )
–2
f *E(f )
2
(cm s )
–2
(a)
(b)
(c)
Fig. 5.6.10 Rotary spectra from current meters on
the flanks of the overflow at the named sites in the
Irminger Sea. For the two sites nearer to the sill, the
variance of the anticyclonic flow (dashed) exceeds that
of the cyclonic flow (solid); offshore the reverse holds.
For the lower, more distant site no polarization is found.
Two depths are indicated in each panel, that of the
instrument and that of the bottom, both in m.