

in the Irminger basin is the existence of mesoscale
vortices seen in near surface drifter tracks (Krauss,
1996), anticyclonic on the inshore side of the overflow path and cyclonic on the offshore side. The
vortices are surface-intensified and decay with
depth, as seen in a hydrographic survey of the density field (Krauss and Käse, 1998). Spall and Price
(1998) explain the cyclones as the result of potential vorticity (PV) conservation in the Intermediate
Water crossing the sill, but leave the anticyclones
unexplained. The existence of rotary flow at the
depth of the overflow can be deduced from the
Dickson and Brown moored current meter data via
rotary spectral analysis, Figure 5.6.10. Note how
the vortex energy decays with distance downstream.
Inshore of the overflow, and especially at shallow
depth, the anticyclonic circulations may accelerate
the overflow, but otherwise the significance of the
phenomenon is unknown. Similar behaviour was
detected in flow through a deep channel in the
northeast Atlantic called Discovery Gap (Saunders,
1987), although there the swirling flow was interpreted as travelling waves of subinertial frequency.
5.6.5 Analytical models of the overflow
In this section I consider what controls the discharge of the overflow, and the attempts of analytical models to predict the subsequent path and
properties of the overflow. Determinations of the
discharge through the Faroe Bank Channel and the
Denmark Strait have principally used the concept
of rotating hydraulic control in which the flow is
limited by the speed of the fastest internal waves.
SECTION 5 FORMATION AND TRANSPORT OF WATER MASSES
412
427 m
7.86°C
529 m
6.22°C
630 m
1.28°C
730 m
–0.44°C
830 m
–0.60°C
840 m
6.1 cm s
–1 128°
18.9 cm s
–1 315°
53.5 cm s –1 310°
64.8 cm s
–1 304°
51.2 cm s
–1 287°
FBC - Mooring 492 61.352°N 8.163°W
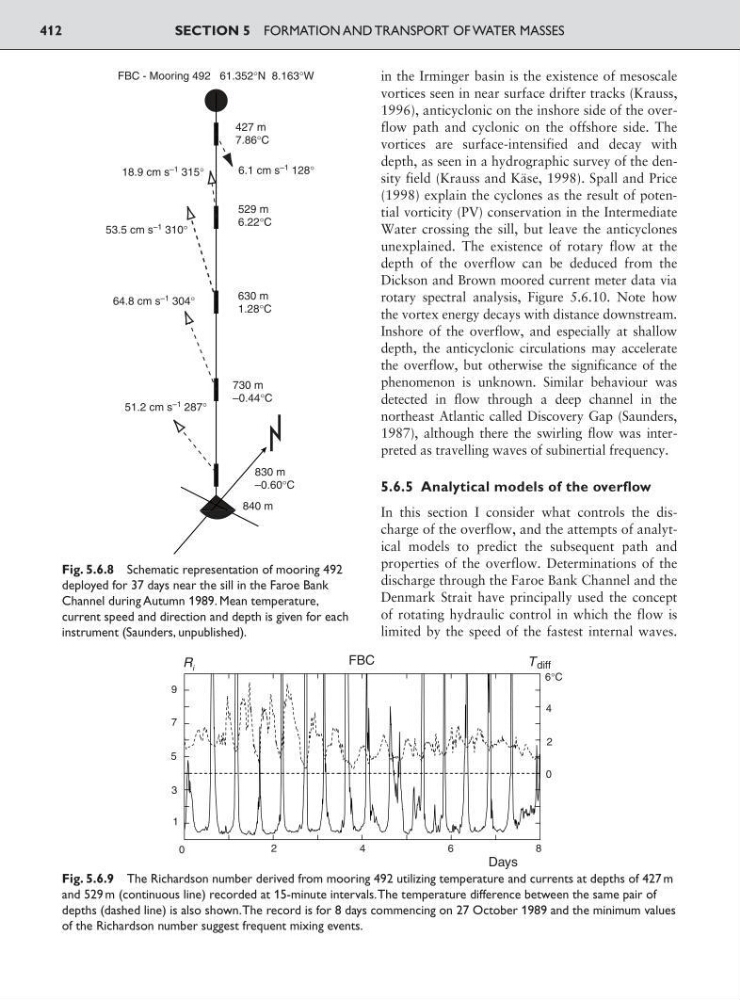
Fig. 5.6.8 Schematic representation of mooring 492
deployed for 37 days near the sill in the Faroe Bank
Channel during Autumn 1989. Mean temperature,
current speed and direction and depth is given for each
instrument (Saunders, unpublished).
R i
0
1
3
5
7
9
2
4
6
Days
8
0
2
4
6°C
T diff
FBC
Fig. 5.6.9 The Richardson number derived from mooring 492 utilizing temperature and currents at depths of 427 m
and 529 m (continuous line) recorded at 15-minute intervals.The temperature difference between the same pair of
depths (dashed line) is also shown.The record is for 8 days commencing on 27 October 1989 and the minimum values
of the Richardson number suggest frequent mixing events.
vortices seen in near surface drifter tracks (Krauss,
1996), anticyclonic on the inshore side of the overflow path and cyclonic on the offshore side. The
vortices are surface-intensified and decay with
depth, as seen in a hydrographic survey of the density field (Krauss and Käse, 1998). Spall and Price
(1998) explain the cyclones as the result of potential vorticity (PV) conservation in the Intermediate
Water crossing the sill, but leave the anticyclones
unexplained. The existence of rotary flow at the
depth of the overflow can be deduced from the
Dickson and Brown moored current meter data via
rotary spectral analysis, Figure 5.6.10. Note how
the vortex energy decays with distance downstream.
Inshore of the overflow, and especially at shallow
depth, the anticyclonic circulations may accelerate
the overflow, but otherwise the significance of the
phenomenon is unknown. Similar behaviour was
detected in flow through a deep channel in the
northeast Atlantic called Discovery Gap (Saunders,
1987), although there the swirling flow was interpreted as travelling waves of subinertial frequency.
5.6.5 Analytical models of the overflow
In this section I consider what controls the discharge of the overflow, and the attempts of analytical models to predict the subsequent path and
properties of the overflow. Determinations of the
discharge through the Faroe Bank Channel and the
Denmark Strait have principally used the concept
of rotating hydraulic control in which the flow is
limited by the speed of the fastest internal waves.
SECTION 5 FORMATION AND TRANSPORT OF WATER MASSES
412
427 m
7.86°C
529 m
6.22°C
630 m
1.28°C
730 m
–0.44°C
830 m
–0.60°C
840 m
6.1 cm s
–1 128°
18.9 cm s
–1 315°
53.5 cm s –1 310°
64.8 cm s
–1 304°
51.2 cm s
–1 287°
FBC - Mooring 492 61.352°N 8.163°W
Fig. 5.6.8 Schematic representation of mooring 492
deployed for 37 days near the sill in the Faroe Bank
Channel during Autumn 1989. Mean temperature,
current speed and direction and depth is given for each
instrument (Saunders, unpublished).
R i
0
1
3
5
7
9
2
4
6
Days
8
0
2
4
6°C
T diff
FBC
Fig. 5.6.9 The Richardson number derived from mooring 492 utilizing temperature and currents at depths of 427 m
and 529 m (continuous line) recorded at 15-minute intervals.The temperature difference between the same pair of
depths (dashed line) is also shown.The record is for 8 days commencing on 27 October 1989 and the minimum values
of the Richardson number suggest frequent mixing events.