

about 2000 km from the Faroe Bank Channel sill
it reaches the complex region of the CGFZ and
threads its way through the two east–west transform valleys.
The topographic complexity of the region is such
that the author elected to place the transport array
within both valleys at its western end (Saunders,
1994). Here the overflow is seen as a salinity maximum (c. 34.98) with a potential temperature of
about 2.9°C but now occupying the deeper levels
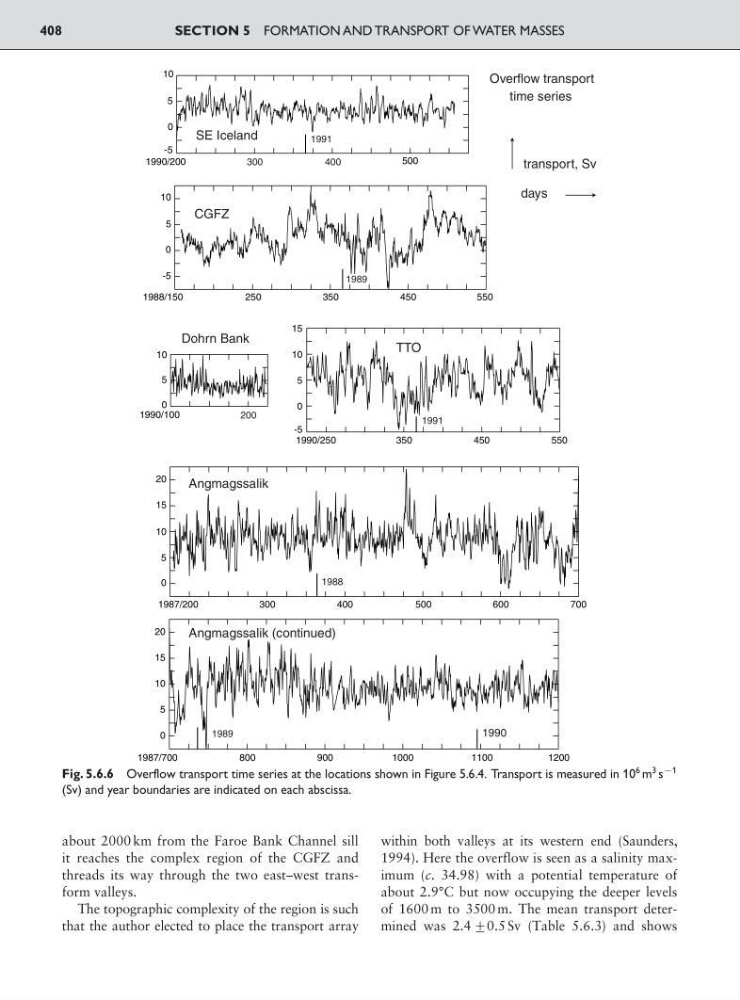
of 1600 m to 3500 m. The mean transport determined was 2.4 <0.5 Sv (Table 5.6.3) and shows
SECTION 5 FORMATION AND TRANSPORT OF WATER MASSES
408
1990/200
500
-5
0
5
10
1988/150
250
350
450
550
-5
0
5
10
1990/100
0
5
10
1987/200
300
400
500
600
700
0
5
10
15
20
1987/700
800
900
1000
1100
1200
0
5
10
15
20
300
400
200
SE Iceland
CGFZ
Dohrn Bank
TTO
Angmagssalik
Angmagssalik (continued)
1990/250
350
450
550
-5
0
5
10
15
1988
1989
1991
1989
1991
1990
Overflow transport
time series
transport, Sv
days
Fig. 5.6.6 Overflow transport time series at the locations shown in Figure 5.6.4. Transport is measured in 10
6 m
3 s
91
(Sv) and year boundaries are indicated on each abscissa.
it reaches the complex region of the CGFZ and
threads its way through the two east–west transform valleys.
The topographic complexity of the region is such
that the author elected to place the transport array
within both valleys at its western end (Saunders,
1994). Here the overflow is seen as a salinity maximum (c. 34.98) with a potential temperature of
about 2.9°C but now occupying the deeper levels
of 1600 m to 3500 m. The mean transport determined was 2.4 <0.5 Sv (Table 5.6.3) and shows
SECTION 5 FORMATION AND TRANSPORT OF WATER MASSES
408
1990/200
500
-5
0
5
10
1988/150
250
350
450
550
-5
0
5
10
1990/100
0
5
10
1987/200
300
400
500
600
700
0
5
10
15
20
1987/700
800
900
1000
1100
1200
0
5
10
15
20
300
400
200
SE Iceland
CGFZ
Dohrn Bank
TTO
Angmagssalik
Angmagssalik (continued)
1990/250
350
450
550
-5
0
5
10
15
1988
1989
1991
1989
1991
1990
Overflow transport
time series
transport, Sv
days
Fig. 5.6.6 Overflow transport time series at the locations shown in Figure 5.6.4. Transport is measured in 10
6 m
3 s
91
(Sv) and year boundaries are indicated on each abscissa.