

5.6.3.2 Transport statistics
All of the re-analysed records along with the earlier data sets of the author’s have been averaged
over a 12-hour period utilizing a simple top-hat
filter. From these data sets the transport time
series have been constructed, first the time series of
the downstream transport per mooring and then
by integrating cross-stream the time series of the
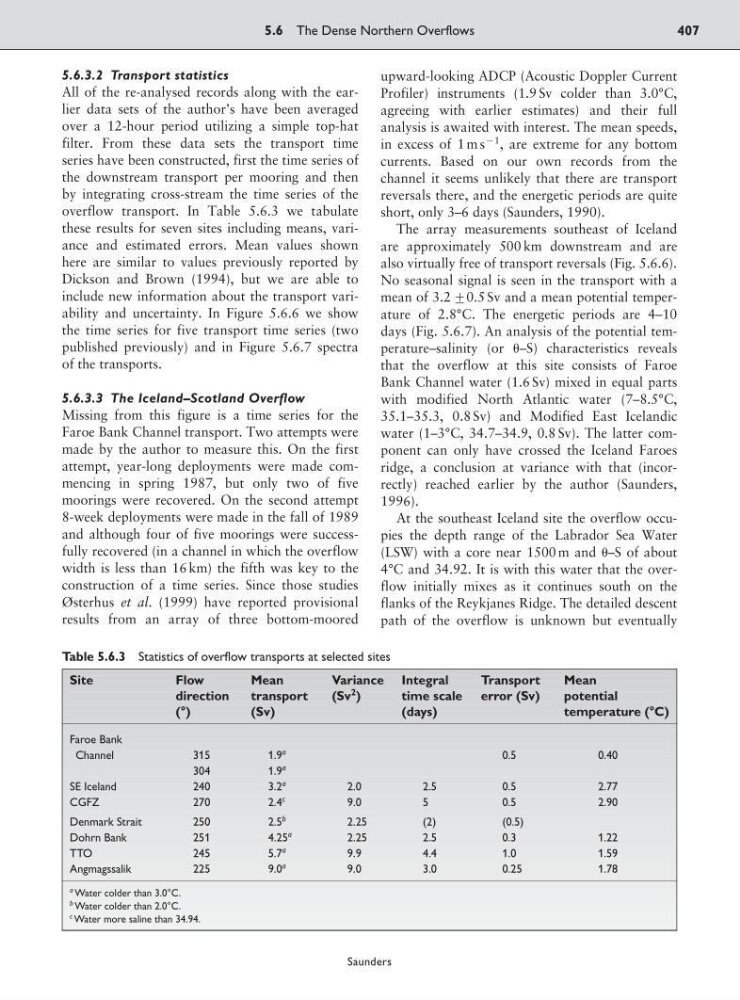
overflow transport. In Table 5.6.3 we tabulate
these results for seven sites including means, variance and estimated errors. Mean values shown
here are similar to values previously reported by
Dickson and Brown (1994), but we are able to
include new information about the transport variability and uncertainty. In Figure 5.6.6 we show
the time series for five transport time series (two
published previously) and in Figure 5.6.7 spectra
of the transports.
5.6.3.3 The Iceland–Scotland Overflow
Missing from this figure is a time series for the
Faroe Bank Channel transport. Two attempts were
made by the author to measure this. On the first
attempt, year-long deployments were made commencing in spring 1987, but only two of five
moorings were recovered. On the second attempt
8-week deployments were made in the fall of 1989
and although four of five moorings were successfully recovered (in a channel in which the overflow
width is less than 16 km) the fifth was key to the
construction of a time series. Since those studies
Østerhus et al. (1999) have reported provisional
results from an array of three bottom-moored
upward-looking ADCP (Acoustic Doppler Current
Profiler) instruments (1.9 Sv colder than 3.0°C,
agreeing with earlier estimates) and their full
analysis is awaited with interest. The mean speeds,
in excess of 1 m s
91 , are extreme for any bottom
currents. Based on our own records from the
channel it seems unlikely that there are transport
reversals there, and the energetic periods are quite
short, only 3–6 days (Saunders, 1990).
The array measurements southeast of Iceland
are approximately 500 km downstream and are
also virtually free of transport reversals (Fig. 5.6.6).
No seasonal signal is seen in the transport with a
mean of 3.2 <0.5 Sv and a mean potential temperature of 2.8°C. The energetic periods are 4–10
days (Fig. 5.6.7). An analysis of the potential temperature–salinity (or –S) characteristics reveals
that the overflow at this site consists of Faroe
Bank Channel water (1.6 Sv) mixed in equal parts
with modified North Atlantic water (7–8.5°C,
35.1–35.3, 0.8 Sv) and Modified East Icelandic
water (1–3°C, 34.7–34.9, 0.8 Sv). The latter component can only have crossed the Iceland Faroes
ridge, a conclusion at variance with that (incorrectly) reached earlier by the author (Saunders,
1996).
At the southeast Iceland site the overflow occupies the depth range of the Labrador Sea Water
(LSW) with a core near 1500 m and –S of about
4°C and 34.92. It is with this water that the overflow initially mixes as it continues south on the
flanks of the Reykjanes Ridge. The detailed descent
path of the overflow is unknown but eventually
5.6 The Dense Northern Overflows
407
Saunders
Table 5.6.3 Statistics of overflow transports at selected sites
Site
Flow
Mean
Variance Integral
Transport
Mean
direction
transport
(Sv
2 )
time scale error (Sv)
potential
(°)
(Sv)
(days)
temperature (°C)
Faroe Bank
Channel
315
1.9
a
0.5
0.40
304
1.9
a
SE Iceland
240
3.2
a
2.0
2.5
0.5
2.77
CGFZ
270
2.4
c
9.0
5
0.5
2.90
Denmark Strait
250
2.5
b
2.25
(2)
(0.5)
Dohrn Bank
251
4.25
a
2.25
2.5
0.3
1.22
TTO
245
5.7
a
9.9
4.4
1.0
1.59
Angmagssalik
225
9.0
a
9.0
3.0
0.25
1.78
a Water colder than 3.0°C.
b Water colder than 2.0°C.
c Water more saline than 34.94.
All of the re-analysed records along with the earlier data sets of the author’s have been averaged
over a 12-hour period utilizing a simple top-hat
filter. From these data sets the transport time
series have been constructed, first the time series of
the downstream transport per mooring and then
by integrating cross-stream the time series of the
overflow transport. In Table 5.6.3 we tabulate
these results for seven sites including means, variance and estimated errors. Mean values shown
here are similar to values previously reported by
Dickson and Brown (1994), but we are able to
include new information about the transport variability and uncertainty. In Figure 5.6.6 we show
the time series for five transport time series (two
published previously) and in Figure 5.6.7 spectra
of the transports.
5.6.3.3 The Iceland–Scotland Overflow
Missing from this figure is a time series for the
Faroe Bank Channel transport. Two attempts were
made by the author to measure this. On the first
attempt, year-long deployments were made commencing in spring 1987, but only two of five
moorings were recovered. On the second attempt
8-week deployments were made in the fall of 1989
and although four of five moorings were successfully recovered (in a channel in which the overflow
width is less than 16 km) the fifth was key to the
construction of a time series. Since those studies
Østerhus et al. (1999) have reported provisional
results from an array of three bottom-moored
upward-looking ADCP (Acoustic Doppler Current
Profiler) instruments (1.9 Sv colder than 3.0°C,
agreeing with earlier estimates) and their full
analysis is awaited with interest. The mean speeds,
in excess of 1 m s
91 , are extreme for any bottom
currents. Based on our own records from the
channel it seems unlikely that there are transport
reversals there, and the energetic periods are quite
short, only 3–6 days (Saunders, 1990).
The array measurements southeast of Iceland
are approximately 500 km downstream and are
also virtually free of transport reversals (Fig. 5.6.6).
No seasonal signal is seen in the transport with a
mean of 3.2 <0.5 Sv and a mean potential temperature of 2.8°C. The energetic periods are 4–10
days (Fig. 5.6.7). An analysis of the potential temperature–salinity (or –S) characteristics reveals
that the overflow at this site consists of Faroe
Bank Channel water (1.6 Sv) mixed in equal parts
with modified North Atlantic water (7–8.5°C,
35.1–35.3, 0.8 Sv) and Modified East Icelandic
water (1–3°C, 34.7–34.9, 0.8 Sv). The latter component can only have crossed the Iceland Faroes
ridge, a conclusion at variance with that (incorrectly) reached earlier by the author (Saunders,
1996).
At the southeast Iceland site the overflow occupies the depth range of the Labrador Sea Water
(LSW) with a core near 1500 m and –S of about
4°C and 34.92. It is with this water that the overflow initially mixes as it continues south on the
flanks of the Reykjanes Ridge. The detailed descent
path of the overflow is unknown but eventually
5.6 The Dense Northern Overflows
407
Saunders
Table 5.6.3 Statistics of overflow transports at selected sites
Site
Flow
Mean
Variance Integral
Transport
Mean
direction
transport
(Sv
2 )
time scale error (Sv)
potential
(°)
(Sv)
(days)
temperature (°C)
Faroe Bank
Channel
315
1.9
a
0.5
0.40
304
1.9
a
SE Iceland
240
3.2
a
2.0
2.5
0.5
2.77
CGFZ
270
2.4
c
9.0
5
0.5
2.90
Denmark Strait
250
2.5
b
2.25
(2)
(0.5)
Dohrn Bank
251
4.25
a
2.25
2.5
0.3
1.22
TTO
245
5.7
a
9.9
4.4
1.0
1.59
Angmagssalik
225
9.0
a
9.0
3.0
0.25
1.78
a Water colder than 3.0°C.
b Water colder than 2.0°C.
c Water more saline than 34.94.