

with rotor-vane recording current meters manufactured by Aanderaa. The exception is the Faroe
Bank Channel deployment reported by Østerhus
et al. (1999), who employed upward-looking
ADCP instruments. So far only provisional results
have been reported from this experiment.
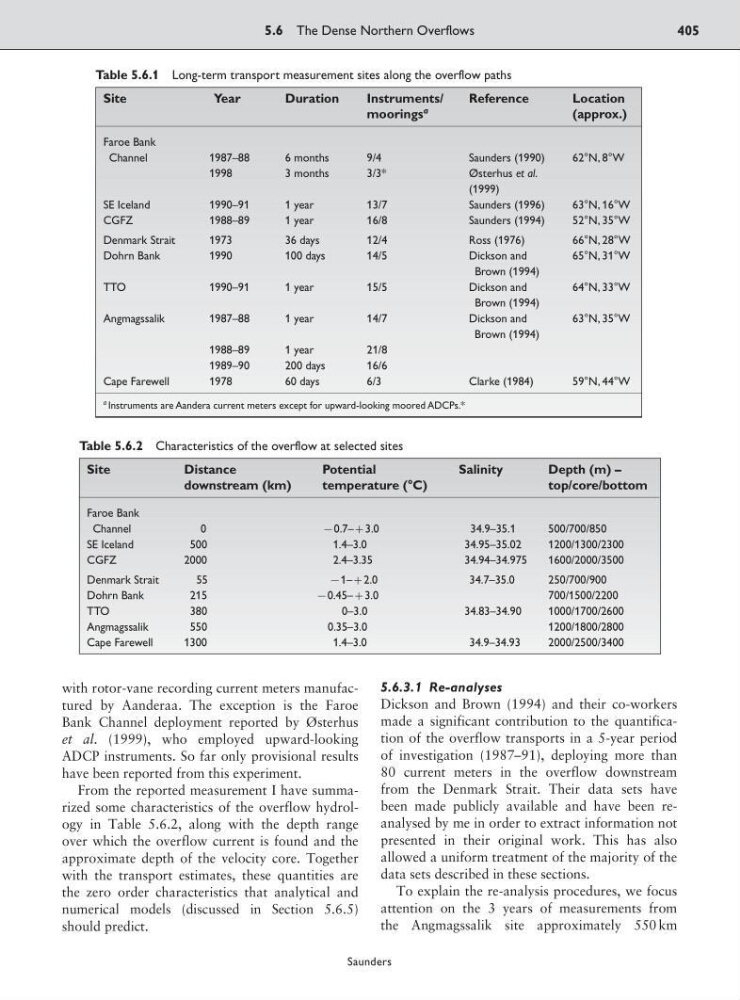
From the reported measurement I have summarized some characteristics of the overflow hydrology in Table 5.6.2, along with the depth range
over which the overflow current is found and the
approximate depth of the velocity core. Together
with the transport estimates, these quantities are
the zero order characteristics that analytical and
numerical models (discussed in Section 5.6.5)
should predict.
5.6.3.1 Re-analyses
Dickson and Brown (1994) and their co-workers
made a significant contribution to the quantification of the overflow transports in a 5-year period
of investigation (1987–91), deploying more than
80 current meters in the overflow downstream
from the Denmark Strait. Their data sets have
been made publicly available and have been reanalysed by me in order to extract information not
presented in their original work. This has also
allowed a uniform treatment of the majority of the
data sets described in these sections.
To explain the re-analysis procedures, we focus
attention on the 3 years of measurements from
the Angmagssalik site approximately 550 km
5.6 The Dense Northern Overflows
405
Saunders
Table 5.6.1 Long-term transport measurement sites along the overflow paths
Site
Year
Duration
Instruments/
Reference
Location
moorings
a
(approx.)
Faroe Bank
Channel
1987–88
6 months
9/4
Saunders (1990)
62°N, 8°W
1998
3 months
3/3*
Østerhus et al.
(1999)
SE Iceland
1990–91
1 year
13/7
Saunders (1996)
63°N, 16°W
CGFZ
1988–89
1 year
16/8
Saunders (1994)
52°N, 35°W
Denmark Strait
1973
36 days
12/4
Ross (1976)
66°N, 28°W
Dohrn Bank
1990
100 days
14/5
Dickson and
65°N, 31°W
Brown (1994)
TTO
1990–91
1 year
15/5
Dickson and
64°N, 33°W
Brown (1994)
Angmagssalik
1987–88
1 year
14/7
Dickson and
63°N, 35°W
Brown (1994)
1988–89
1 year
21/8
1989–90
200 days
16/6
Cape Farewell
1978
60 days
6/3
Clarke (1984)
59°N, 44°W
a Instruments are Aandera current meters except for upward-looking moored ADCPs.*
Table 5.6.2 Characteristics of the overflow at selected sites
Site
Distance
Potential
Salinity
Depth (m) –
downstream (km)
temperature (°C)
top/core/bottom
Faroe Bank
Channel
0
90.7–;3.0
3 4 .9–35.1
500/700/850
SE Iceland
500
1.4–3.0
3 4 .95–35.02
1200/1300/2300
CGFZ
2000
2.4–3.35
34.94–34.975
1600/2000/3500
Denmark Strait
55
91–;2.0
3 4 .7–35.0
250/700/900
Dohrn Bank
215
90.45–;3.0
700/1500/2200
TTO
380
0–3.0
3 4 .83–34.90
1000/1700/2600
Angmagssalik
550
0.35–3.0
1200/1800/2800
Cape Farewell
1300
1.4–3.0
3 4 .9–34.93
2000/2500/3400
Bank Channel deployment reported by Østerhus
et al. (1999), who employed upward-looking
ADCP instruments. So far only provisional results
have been reported from this experiment.
From the reported measurement I have summarized some characteristics of the overflow hydrology in Table 5.6.2, along with the depth range
over which the overflow current is found and the
approximate depth of the velocity core. Together
with the transport estimates, these quantities are
the zero order characteristics that analytical and
numerical models (discussed in Section 5.6.5)
should predict.
5.6.3.1 Re-analyses
Dickson and Brown (1994) and their co-workers
made a significant contribution to the quantification of the overflow transports in a 5-year period
of investigation (1987–91), deploying more than
80 current meters in the overflow downstream
from the Denmark Strait. Their data sets have
been made publicly available and have been reanalysed by me in order to extract information not
presented in their original work. This has also
allowed a uniform treatment of the majority of the
data sets described in these sections.
To explain the re-analysis procedures, we focus
attention on the 3 years of measurements from
the Angmagssalik site approximately 550 km
5.6 The Dense Northern Overflows
405
Saunders
Table 5.6.1 Long-term transport measurement sites along the overflow paths
Site
Year
Duration
Instruments/
Reference
Location
moorings
a
(approx.)
Faroe Bank
Channel
1987–88
6 months
9/4
Saunders (1990)
62°N, 8°W
1998
3 months
3/3*
Østerhus et al.
(1999)
SE Iceland
1990–91
1 year
13/7
Saunders (1996)
63°N, 16°W
CGFZ
1988–89
1 year
16/8
Saunders (1994)
52°N, 35°W
Denmark Strait
1973
36 days
12/4
Ross (1976)
66°N, 28°W
Dohrn Bank
1990
100 days
14/5
Dickson and
65°N, 31°W
Brown (1994)
TTO
1990–91
1 year
15/5
Dickson and
64°N, 33°W
Brown (1994)
Angmagssalik
1987–88
1 year
14/7
Dickson and
63°N, 35°W
Brown (1994)
1988–89
1 year
21/8
1989–90
200 days
16/6
Cape Farewell
1978
60 days
6/3
Clarke (1984)
59°N, 44°W
a Instruments are Aandera current meters except for upward-looking moored ADCPs.*
Table 5.6.2 Characteristics of the overflow at selected sites
Site
Distance
Potential
Salinity
Depth (m) –
downstream (km)
temperature (°C)
top/core/bottom
Faroe Bank
Channel
0
90.7–;3.0
3 4 .9–35.1
500/700/850
SE Iceland
500
1.4–3.0
3 4 .95–35.02
1200/1300/2300
CGFZ
2000
2.4–3.35
34.94–34.975
1600/2000/3500
Denmark Strait
55
91–;2.0
3 4 .7–35.0
250/700/900
Dohrn Bank
215
90.45–;3.0
700/1500/2200
TTO
380
0–3.0
3 4 .83–34.90
1000/1700/2600
Angmagssalik
550
0.35–3.0
1200/1800/2800
Cape Farewell
1300
1.4–3.0
3 4 .9–34.93
2000/2500/3400