

Fracture Zone (CGFZ) and instead passes south
along the east flank of the mid-Atlantic ridge?
(Tracer data confirms that overflow water can
be seen at 48°N, and even estimates of its transport have been made (Fleischmann and Rhein,
2000).)
¥ What is the path of the eastern overflow when it
exits the CGFZ into the Irminger basin? On exit
it occupies a depth range 2000–3500 m, is separated from the bottom and has its core near
2500 m. The overflow is believed to turn northward along the western flanks of the Reykjanes
Ridge before crossing the gently upsloping floor
of the Irminger basin from east to west. But is
the crossing concentrated or diffuse? And in
what range of latitudes does it occur?
The above questions may be answered in part
by detailed hydrographic and tracer studies supported by lowered ADCP (Acoustic Doppler Current Profiler) measurements, but to proceed from
snapshots to means will require arrays of moored
instruments of the kind which have already
furnished the crucial information concerning the
overflow fluxes. The locations of such major
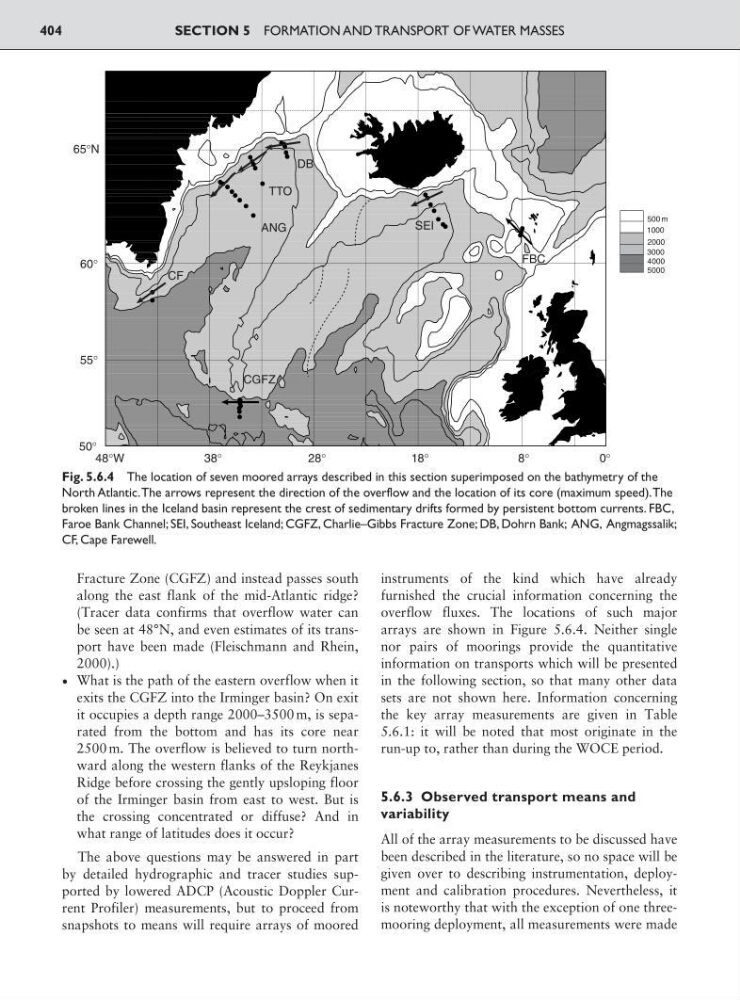
arrays are shown in Figure 5.6.4. Neither single
nor pairs of moorings provide the quantitative
information on transports which will be presented
in the following section, so that many other data
sets are not shown here. Information concerning
the key array measurements are given in Table
5.6.1: it will be noted that most originate in the
run-up to, rather than during the WOCE period.
5.6.3 Observed transport means and
variability
All of the array measurements to be discussed have
been described in the literature, so no space will be
given over to describing instrumentation, deployment and calibration procedures. Nevertheless, it
is noteworthy that with the exception of one threemooring deployment, all measurements were made
SECTION 5 FORMATION AND TRANSPORT OF WATER MASSES
404
65°N
60°
55°
50°
48°W
3 8 °
28°
18°
8 °
0 °
500 m
1000
2000
3000
4000
5000
FBC
SEI
DB
TTO
ANG
CF
CGFZ
Fig. 5.6.4 The location of seven moored arrays described in this section superimposed on the bathymetry of the
North Atlantic.The arrows represent the direction of the overflow and the location of its core (maximum speed).The
broken lines in the Iceland basin represent the crest of sedimentary drifts formed by persistent bottom currents. FBC,
Faroe Bank Channel; SEI, Southeast Iceland; CGFZ, Charlie–Gibbs Fracture Zone; DB, Dohrn Bank; ANG, Angmagssalik;
CF, Cape Farewell.
along the east flank of the mid-Atlantic ridge?
(Tracer data confirms that overflow water can
be seen at 48°N, and even estimates of its transport have been made (Fleischmann and Rhein,
2000).)
¥ What is the path of the eastern overflow when it
exits the CGFZ into the Irminger basin? On exit
it occupies a depth range 2000–3500 m, is separated from the bottom and has its core near
2500 m. The overflow is believed to turn northward along the western flanks of the Reykjanes
Ridge before crossing the gently upsloping floor
of the Irminger basin from east to west. But is
the crossing concentrated or diffuse? And in
what range of latitudes does it occur?
The above questions may be answered in part
by detailed hydrographic and tracer studies supported by lowered ADCP (Acoustic Doppler Current Profiler) measurements, but to proceed from
snapshots to means will require arrays of moored
instruments of the kind which have already
furnished the crucial information concerning the
overflow fluxes. The locations of such major
arrays are shown in Figure 5.6.4. Neither single
nor pairs of moorings provide the quantitative
information on transports which will be presented
in the following section, so that many other data
sets are not shown here. Information concerning
the key array measurements are given in Table
5.6.1: it will be noted that most originate in the
run-up to, rather than during the WOCE period.
5.6.3 Observed transport means and
variability
All of the array measurements to be discussed have
been described in the literature, so no space will be
given over to describing instrumentation, deployment and calibration procedures. Nevertheless, it
is noteworthy that with the exception of one threemooring deployment, all measurements were made
SECTION 5 FORMATION AND TRANSPORT OF WATER MASSES
404
65°N
60°
55°
50°
48°W
3 8 °
28°
18°
8 °
0 °
500 m
1000
2000
3000
4000
5000
FBC
SEI
DB
TTO
ANG
CF
CGFZ
Fig. 5.6.4 The location of seven moored arrays described in this section superimposed on the bathymetry of the
North Atlantic.The arrows represent the direction of the overflow and the location of its core (maximum speed).The
broken lines in the Iceland basin represent the crest of sedimentary drifts formed by persistent bottom currents. FBC,
Faroe Bank Channel; SEI, Southeast Iceland; CGFZ, Charlie–Gibbs Fracture Zone; DB, Dohrn Bank; ANG, Angmagssalik;
CF, Cape Farewell.