

overflow. This picture was elaborated by Dickson
and Brown (1994), who 10 years after Swift quantified the transports (discussed in Section 5.6.3). Our
own version of the path of the overflows shows the
same picture (Fig. 5.6.4) and despite the last several
years effort both within and without WOCE, there
are still a number of questions remaining.
¥ It has long been recognized that the deepest levels of the Iceland Basin are filled with very cold
water that descends steeply downslope near the
exit of the Faroe Bank Channel (Crease, 1965).
How and why? Most of the overflows for most
of their path cross the slope at very shallow
angles but evidently details of the terrain play a
crucial role.
¥ What is the path of the overflow on the eastern
flanks of the Reykjanes Ridge? In particular
what is the relation of the overflow waters to
the prominent depositional drifts present in the
Iceland basin and sketched on Figure 5.6.4?
¥ What fraction of the Iceland–Scotland overflow does not pass through the Charlie–Gibbs
5.6 The Dense Northern Overflows
403
Saunders
0
200
400
600
0
100
200
300 km
0
200
400
600
0
100
200
300 km
6
6
3
1
0
0
-1.5
0.5
0.5
Temperature
Salinity
34.2
34.4
34.6
34.8 34.9
35
34.92
Greenland
Iceland
m
m
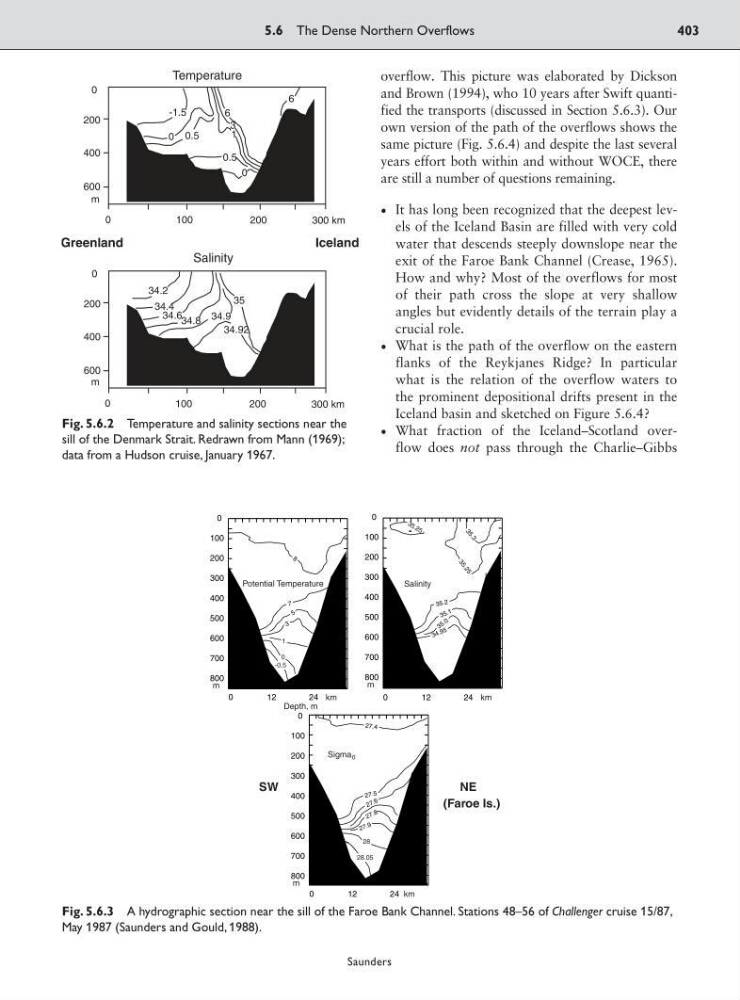
Fig. 5.6.2 Temperature and salinity sections near the
sill of the Denmark Strait. Redrawn from Mann (1969);
data from a Hudson cruise, January 1967.
0
12
24
800
700
600
500
400
300
200
100
0
8
3
5
7
0
12
24
800
700
600
500
400
300
200
100
0
3 5 .2 5
3 4 .9 5
3 5 .0
3 5 .1
35 .2
3
5
.2
5
3
5
.3
0
12
24
800
700
600
500
400
300
200
100
0
27.4
27 .9
2 7 .8
2 7 .6
27 .5
-0.5
0
1
28.05
28
Potential Temperature
Salinity
Sigma 0
km
km
km
Depth, m
SW
NE
(Faroe Is.)
m
m
m
Fig. 5.6.3 A hydrographic section near the sill of the Faroe Bank Channel. Stations 48–56 of Challenger cruise 15/87,
May 1987 (Saunders and Gould, 1988).
and Brown (1994), who 10 years after Swift quantified the transports (discussed in Section 5.6.3). Our
own version of the path of the overflows shows the
same picture (Fig. 5.6.4) and despite the last several
years effort both within and without WOCE, there
are still a number of questions remaining.
¥ It has long been recognized that the deepest levels of the Iceland Basin are filled with very cold
water that descends steeply downslope near the
exit of the Faroe Bank Channel (Crease, 1965).
How and why? Most of the overflows for most
of their path cross the slope at very shallow
angles but evidently details of the terrain play a
crucial role.
¥ What is the path of the overflow on the eastern
flanks of the Reykjanes Ridge? In particular
what is the relation of the overflow waters to
the prominent depositional drifts present in the
Iceland basin and sketched on Figure 5.6.4?
¥ What fraction of the Iceland–Scotland overflow does not pass through the Charlie–Gibbs
5.6 The Dense Northern Overflows
403
Saunders
0
200
400
600
0
100
200
300 km
0
200
400
600
0
100
200
300 km
6
6
3
1
0
0
-1.5
0.5
0.5
Temperature
Salinity
34.2
34.4
34.6
34.8 34.9
35
34.92
Greenland
Iceland
m
m
Fig. 5.6.2 Temperature and salinity sections near the
sill of the Denmark Strait. Redrawn from Mann (1969);
data from a Hudson cruise, January 1967.
0
12
24
800
700
600
500
400
300
200
100
0
8
3
5
7
0
12
24
800
700
600
500
400
300
200
100
0
3 5 .2 5
3 4 .9 5
3 5 .0
3 5 .1
35 .2
3
5
.2
5
3
5
.3
0
12
24
800
700
600
500
400
300
200
100
0
27.4
27 .9
2 7 .8
2 7 .6
27 .5
-0.5
0
1
28.05
28
Potential Temperature
Salinity
Sigma 0
km
km
km
Depth, m
SW
NE
(Faroe Is.)
m
m
m
Fig. 5.6.3 A hydrographic section near the sill of the Faroe Bank Channel. Stations 48–56 of Challenger cruise 15/87,
May 1987 (Saunders and Gould, 1988).