

correspond to passage of such eddies. In cold years,
active with wintertime convection, many of these
eddies have an identifiable core of relatively pure,
cold, convected water and hence are associated
with convection. Their origins are not yet known,
but the dynamically active boundary currents on
both Greenland and Labrador continental rises are
two known sources, and their generation purely by
convection has been documented in model studies
(Jones and Marshall, 1993; Maxworthy and
Narimousa, 1994; Rhines, 1998).
As noted, the speed of the current from October
through February is Ϸ 0.07 m s
91 and roughly twice
that after 1 March. Long-lived sub-mesoscale and
mesoscale eddies have, in subsequent years altered
this simple picture of a late-winter maximum in
kinetic energy. The first of the two pieces of data
used to calculate the spectral estimates shown in
Figure 5.5.8 is therefore in the slow regime, while
the later one is in the fast regime. If horizontal gradients being swept past the mooring are the cause
of the temperature and salinity variability in the
moored records, the doubling of the current speed
would cause a doubling of the frequency of features
with fixed horizontal scales. This effect is not obvious between the two spectra because the horizontal
scales of the gradients are distributed broadly over
the spectrum. Thus no clearly defined spectral
peaks are created to be traced from one period
to another except possibly the peak in the early
spectrum at Ϸ 0.07 cph (cycles per hour). This
broad peak includes two maxima; one at the
inertial frequency (0.067 cph) and one for the semidiurnal tides (0.08 cph) but it can’t be identified in
the later spectrum because of the large scatter.
When convection stops, the vertical density
stratification is re-established and the horizontal
gradients that were brought to intermediate depths
in the mixed layer are no longer renewed. Those
existing when convection ends are slowly mixed
away by horizontal eddy diffusion. Assuming a
horizontal scale L of 100 km for the region of convection with its small-scale horizontal variations,
then the time scale of eddy mixing will be about
L
2 /K H , where K H , the horizontal eddy diffusivity,
is Ϸ 10
3 m
2 s
91 (Sundermeyer and Price, 1998).
This gives a time scale for the horizontal mixing
of Ϸ 4 months, which is about the decay time
observed in the records.
5.5.4 Restratification
At the end of the cooling season, vertical mixing due
to convection ceases and its dominant influence
on mid-depth water properties ends. This also
marks the beginning of the restratification process,
during which the vertical stratification that existed
prior to the homogenization is re-established. As
mentioned earlier, the end of convection is indicated by the rapid decrease in 1.5 at 260 and
510 m over the first 20 days in April indicated in
Figure 5.5.5 (see Plate 5.5.5, p. 428). There are no
data for this year after early June 1995 but there is
a decreasing trend in 1.5 at 260, 510 and 1010 m
between June 1994 and the arrival of convection
in February 1995. This, we assume, is due to a
continuation of the restratification process following deep convection in the winter of 1993–94,
which suggests to us that there are two restratification time scales: an initial rapid change that takes
place over the month immediately after the cessation of convection, and a multimonth adjustment
that continues until it is interrupted by the next
convection event. Presumably a steady-state vertical density profile would eventually be reached if
convection did not intervene.
Considering the initial stage of restratification
evident in Figure 5.5.5 (see Plate 5.5.5, p. 428), it
is not clear if this indicates an end to convection
over a large area, or the advection of a stratified
non-convecting water column to the observation
site. However, the first option seems more likely as
the end of convection appears in other records as a
SECTION 5 FORMATION AND TRANSPORT OF WATER MASSES
396
–800 –700 –600 –500 –400 –300 –200 –100 0
100
–600
–500
–400
–300
–200
–100
0
100
June
July
Aug
Sept
Oct
Nov
Dec
Jan
Feb
Mar
Apr
May
June
East (km)
North (km)
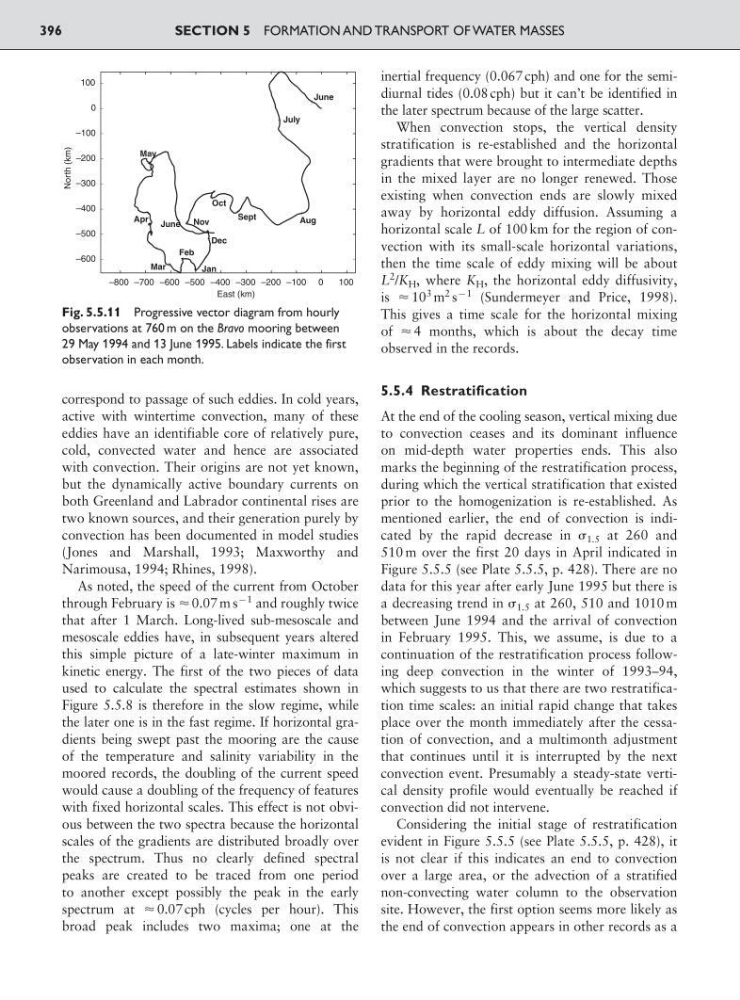
Fig. 5.5.11 Progressive vector diagram from hourly
observations at 760 m on the Bravo mooring between
29 May 1994 and 13 June 1995. Labels indicate the first
observation in each month.
active with wintertime convection, many of these
eddies have an identifiable core of relatively pure,
cold, convected water and hence are associated
with convection. Their origins are not yet known,
but the dynamically active boundary currents on
both Greenland and Labrador continental rises are
two known sources, and their generation purely by
convection has been documented in model studies
(Jones and Marshall, 1993; Maxworthy and
Narimousa, 1994; Rhines, 1998).
As noted, the speed of the current from October
through February is Ϸ 0.07 m s
91 and roughly twice
that after 1 March. Long-lived sub-mesoscale and
mesoscale eddies have, in subsequent years altered
this simple picture of a late-winter maximum in
kinetic energy. The first of the two pieces of data
used to calculate the spectral estimates shown in
Figure 5.5.8 is therefore in the slow regime, while
the later one is in the fast regime. If horizontal gradients being swept past the mooring are the cause
of the temperature and salinity variability in the
moored records, the doubling of the current speed
would cause a doubling of the frequency of features
with fixed horizontal scales. This effect is not obvious between the two spectra because the horizontal
scales of the gradients are distributed broadly over
the spectrum. Thus no clearly defined spectral
peaks are created to be traced from one period
to another except possibly the peak in the early
spectrum at Ϸ 0.07 cph (cycles per hour). This
broad peak includes two maxima; one at the
inertial frequency (0.067 cph) and one for the semidiurnal tides (0.08 cph) but it can’t be identified in
the later spectrum because of the large scatter.
When convection stops, the vertical density
stratification is re-established and the horizontal
gradients that were brought to intermediate depths
in the mixed layer are no longer renewed. Those
existing when convection ends are slowly mixed
away by horizontal eddy diffusion. Assuming a
horizontal scale L of 100 km for the region of convection with its small-scale horizontal variations,
then the time scale of eddy mixing will be about
L
2 /K H , where K H , the horizontal eddy diffusivity,
is Ϸ 10
3 m
2 s
91 (Sundermeyer and Price, 1998).
This gives a time scale for the horizontal mixing
of Ϸ 4 months, which is about the decay time
observed in the records.
5.5.4 Restratification
At the end of the cooling season, vertical mixing due
to convection ceases and its dominant influence
on mid-depth water properties ends. This also
marks the beginning of the restratification process,
during which the vertical stratification that existed
prior to the homogenization is re-established. As
mentioned earlier, the end of convection is indicated by the rapid decrease in 1.5 at 260 and
510 m over the first 20 days in April indicated in
Figure 5.5.5 (see Plate 5.5.5, p. 428). There are no
data for this year after early June 1995 but there is
a decreasing trend in 1.5 at 260, 510 and 1010 m
between June 1994 and the arrival of convection
in February 1995. This, we assume, is due to a
continuation of the restratification process following deep convection in the winter of 1993–94,
which suggests to us that there are two restratification time scales: an initial rapid change that takes
place over the month immediately after the cessation of convection, and a multimonth adjustment
that continues until it is interrupted by the next
convection event. Presumably a steady-state vertical density profile would eventually be reached if
convection did not intervene.
Considering the initial stage of restratification
evident in Figure 5.5.5 (see Plate 5.5.5, p. 428), it
is not clear if this indicates an end to convection
over a large area, or the advection of a stratified
non-convecting water column to the observation
site. However, the first option seems more likely as
the end of convection appears in other records as a
SECTION 5 FORMATION AND TRANSPORT OF WATER MASSES
396
–800 –700 –600 –500 –400 –300 –200 –100 0
100
–600
–500
–400
–300
–200
–100
0
100
June
July
Aug
Sept
Oct
Nov
Dec
Jan
Feb
Mar
Apr
May
June
East (km)
North (km)
Fig. 5.5.11 Progressive vector diagram from hourly
observations at 760 m on the Bravo mooring between
29 May 1994 and 13 June 1995. Labels indicate the first
observation in each month.