

‘tend to compensate in their effect on density’.
From these results we tentatively conclude that the
compensating temperature and salinity variations
originate in the surface layer and are propagated to
intermediate depths during convection.
Data equivalent to that obtained by Rudnick
and Ferrari (1999) has not been collected in the
Labrador Sea. However, CTD profiles collected in
February and March 1997 suggest a similar situation exists there, even during deep convection.
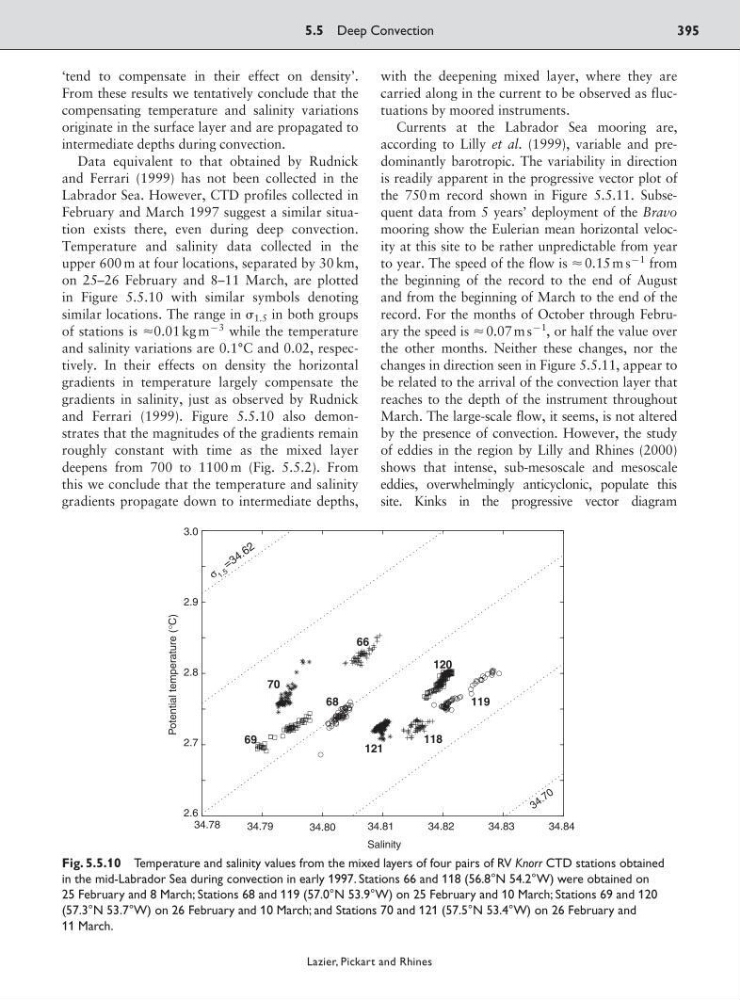
Temperature and salinity data collected in the
upper 600 m at four locations, separated by 30 km,
on 25–26 February and 8–11 March, are plotted
in Figure 5.5.10 with similar symbols denoting
similar locations. The range in 1.5 in both groups
of stations is Ϸ0.01 kg m
93 while the temperature
and salinity variations are 0.1°C and 0.02, respectively. In their effects on density the horizontal
gradients in temperature largely compensate the
gradients in salinity, just as observed by Rudnick
and Ferrari (1999). Figure 5.5.10 also demonstrates that the magnitudes of the gradients remain
roughly constant with time as the mixed layer
deepens from 700 to 1100 m (Fig. 5.5.2). From
this we conclude that the temperature and salinity
gradients propagate down to intermediate depths,
with the deepening mixed layer, where they are
carried along in the current to be observed as fluctuations by moored instruments.
Currents at the Labrador Sea mooring are,
according to Lilly et al. (1999), variable and predominantly barotropic. The variability in direction
is readily apparent in the progressive vector plot of
the 750 m record shown in Figure 5.5.11. Subsequent data from 5 years’ deployment of the Bravo
mooring show the Eulerian mean horizontal velocity at this site to be rather unpredictable from year
to year. The speed of the flow is Ϸ 0.15 m s
91 from
the beginning of the record to the end of August
and from the beginning of March to the end of the
record. For the months of October through February the speed is Ϸ 0.07 m s
91
, or half the value over
the other months. Neither these changes, nor the
changes in direction seen in Figure 5.5.11, appear to
be related to the arrival of the convection layer that
reaches to the depth of the instrument throughout
March. The large-scale flow, it seems, is not altered
by the presence of convection. However, the study
of eddies in the region by Lilly and Rhines (2000)
shows that intense, sub-mesoscale and mesoscale
eddies, overwhelmingly anticyclonic, populate this
site. Kinks in the progressive vector diagram
5.5 Deep Convection
395
Lazier, Pickart and Rhines
66
68
69
70
118
119
120
121
σ
3 4 . 6 2
3 4 . 7 0
Potential temperature (°C)
Fig. 5.5.10 Temperature and salinity values from the mixed layers of four pairs of RV Knorr CTD stations obtained
in the mid-Labrador Sea during convection in early 1997. Stations 66 and 118 (56.8°N 54.2°W) were obtained on
25 February and 8 March; Stations 68 and 119 (57.0°N 53.9°W) on 25 February and 10 March; Stations 69 and 120
(57.3°N 53.7°W) on 26 February and 10 March; and Stations 70 and 121 (57.5°N 53.4°W) on 26 February and
11 March.
From these results we tentatively conclude that the
compensating temperature and salinity variations
originate in the surface layer and are propagated to
intermediate depths during convection.
Data equivalent to that obtained by Rudnick
and Ferrari (1999) has not been collected in the
Labrador Sea. However, CTD profiles collected in
February and March 1997 suggest a similar situation exists there, even during deep convection.
Temperature and salinity data collected in the
upper 600 m at four locations, separated by 30 km,
on 25–26 February and 8–11 March, are plotted
in Figure 5.5.10 with similar symbols denoting
similar locations. The range in 1.5 in both groups
of stations is Ϸ0.01 kg m
93 while the temperature
and salinity variations are 0.1°C and 0.02, respectively. In their effects on density the horizontal
gradients in temperature largely compensate the
gradients in salinity, just as observed by Rudnick
and Ferrari (1999). Figure 5.5.10 also demonstrates that the magnitudes of the gradients remain
roughly constant with time as the mixed layer
deepens from 700 to 1100 m (Fig. 5.5.2). From
this we conclude that the temperature and salinity
gradients propagate down to intermediate depths,
with the deepening mixed layer, where they are
carried along in the current to be observed as fluctuations by moored instruments.
Currents at the Labrador Sea mooring are,
according to Lilly et al. (1999), variable and predominantly barotropic. The variability in direction
is readily apparent in the progressive vector plot of
the 750 m record shown in Figure 5.5.11. Subsequent data from 5 years’ deployment of the Bravo
mooring show the Eulerian mean horizontal velocity at this site to be rather unpredictable from year
to year. The speed of the flow is Ϸ 0.15 m s
91 from
the beginning of the record to the end of August
and from the beginning of March to the end of the
record. For the months of October through February the speed is Ϸ 0.07 m s
91
, or half the value over
the other months. Neither these changes, nor the
changes in direction seen in Figure 5.5.11, appear to
be related to the arrival of the convection layer that
reaches to the depth of the instrument throughout
March. The large-scale flow, it seems, is not altered
by the presence of convection. However, the study
of eddies in the region by Lilly and Rhines (2000)
shows that intense, sub-mesoscale and mesoscale
eddies, overwhelmingly anticyclonic, populate this
site. Kinks in the progressive vector diagram
5.5 Deep Convection
395
Lazier, Pickart and Rhines
66
68
69
70
118
119
120
121
σ
3 4 . 6 2
3 4 . 7 0
Potential temperature (°C)
Fig. 5.5.10 Temperature and salinity values from the mixed layers of four pairs of RV Knorr CTD stations obtained
in the mid-Labrador Sea during convection in early 1997. Stations 66 and 118 (56.8°N 54.2°W) were obtained on
25 February and 8 March; Stations 68 and 119 (57.0°N 53.9°W) on 25 February and 10 March; Stations 69 and 120
(57.3°N 53.7°W) on 26 February and 10 March; and Stations 70 and 121 (57.5°N 53.4°W) on 26 February and
11 March.