

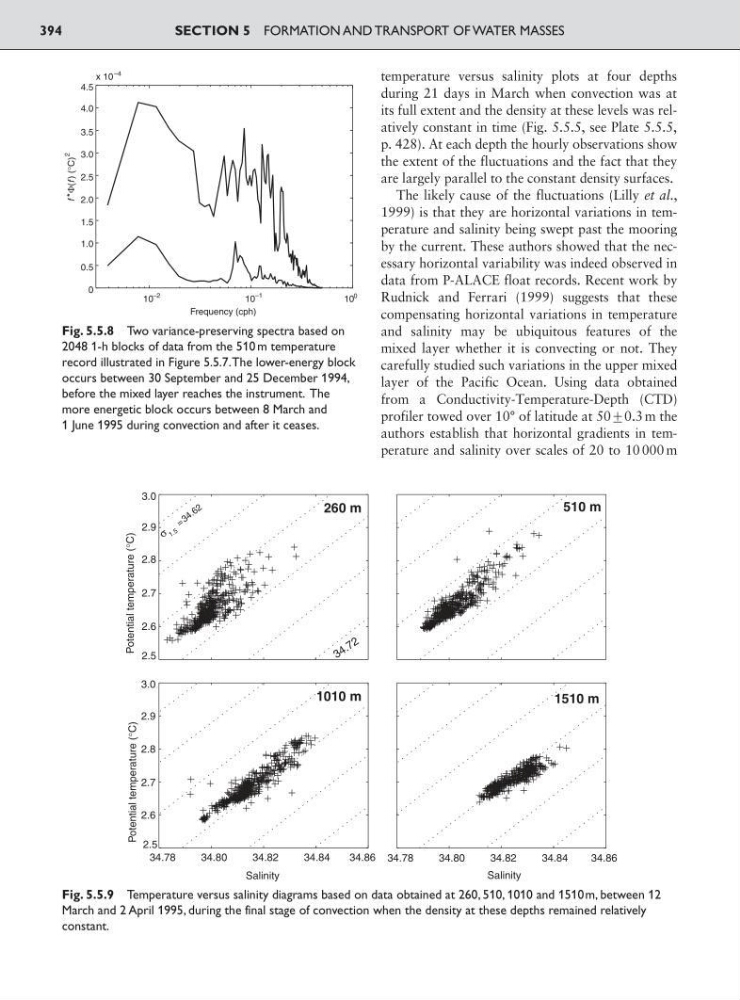
temperature versus salinity plots at four depths
during 21 days in March when convection was at
its full extent and the density at these levels was relatively constant in time (Fig. 5.5.5, see Plate 5.5.5,
p. 428). At each depth the hourly observations show
the extent of the fluctuations and the fact that they
are largely parallel to the constant density surfaces.
The likely cause of the fluctuations (Lilly et al.,
1999) is that they are horizontal variations in temperature and salinity being swept past the mooring
by the current. These authors showed that the necessary horizontal variability was indeed observed in
data from P-ALACE float records. Recent work by
Rudnick and Ferrari (1999) suggests that these
compensating horizontal variations in temperature
and salinity may be ubiquitous features of the
mixed layer whether it is convecting or not. They
carefully studied such variations in the upper mixed
layer of the Pacific Ocean. Using data obtained
from a Conductivity-Temperature-Depth (CTD)
profiler towed over 10° of latitude at 50<0.3 m the
authors establish that horizontal gradients in temperature and salinity over scales of 20 to 10 000 m
SECTION 5 FORMATION AND TRANSPORT OF WATER MASSES
394
10
–2
10
–1
10
0
0
0.5
1.0
1.5
2.0
2.5
3.0
3.5
4.0
4.5
x 10
–4
Frequency (cph)
f
*⌽(f ) (°C)
2
Fig. 5.5.8 Two variance-preserving spectra based on
2048 1-h blocks of data from the 510 m temperature
record illustrated in Figure 5.5.7.The lower-energy block
occurs between 30 September and 25 December 1994,
before the mixed layer reaches the instrument. The
more energetic block occurs between 8 March and
1 June 1995 during convection and after it ceases.
Fig. 5.5.9 Temperature versus salinity diagrams based on data obtained at 260, 510, 1010 and 1510m, between 12
March and 2 April 1995, during the final stage of convection when the density at these depths remained relatively
constant.
2.5
2.6
2.7
2.8
2.9
3.0
σ
= 3 4 . 6 2
3 4 . 7 2
260 m
510 m
34.78
34.80
34.82
34.84
34.86
2.5
2.6
2.7
2.8
2.9
3.0
Salinity
1010 m
34.78
34.80
34.82
34.84
34.86
Salinity
1510 m
Potential temperature (°C)
Potential temperature (°C)
during 21 days in March when convection was at
its full extent and the density at these levels was relatively constant in time (Fig. 5.5.5, see Plate 5.5.5,
p. 428). At each depth the hourly observations show
the extent of the fluctuations and the fact that they
are largely parallel to the constant density surfaces.
The likely cause of the fluctuations (Lilly et al.,
1999) is that they are horizontal variations in temperature and salinity being swept past the mooring
by the current. These authors showed that the necessary horizontal variability was indeed observed in
data from P-ALACE float records. Recent work by
Rudnick and Ferrari (1999) suggests that these
compensating horizontal variations in temperature
and salinity may be ubiquitous features of the
mixed layer whether it is convecting or not. They
carefully studied such variations in the upper mixed
layer of the Pacific Ocean. Using data obtained
from a Conductivity-Temperature-Depth (CTD)
profiler towed over 10° of latitude at 50<0.3 m the
authors establish that horizontal gradients in temperature and salinity over scales of 20 to 10 000 m
SECTION 5 FORMATION AND TRANSPORT OF WATER MASSES
394
10
–2
10
–1
10
0
0
0.5
1.0
1.5
2.0
2.5
3.0
3.5
4.0
4.5
x 10
–4
Frequency (cph)
f
*⌽(f ) (°C)
2
Fig. 5.5.8 Two variance-preserving spectra based on
2048 1-h blocks of data from the 510 m temperature
record illustrated in Figure 5.5.7.The lower-energy block
occurs between 30 September and 25 December 1994,
before the mixed layer reaches the instrument. The
more energetic block occurs between 8 March and
1 June 1995 during convection and after it ceases.
Fig. 5.5.9 Temperature versus salinity diagrams based on data obtained at 260, 510, 1010 and 1510m, between 12
March and 2 April 1995, during the final stage of convection when the density at these depths remained relatively
constant.
2.5
2.6
2.7
2.8
2.9
3.0
σ
= 3 4 . 6 2
3 4 . 7 2
260 m
510 m
34.78
34.80
34.82
34.84
34.86
2.5
2.6
2.7
2.8
2.9
3.0
Salinity
1010 m
34.78
34.80
34.82
34.84
34.86
Salinity
1510 m
Potential temperature (°C)
Potential temperature (°C)