

layer. A large attached drogue then pulls the float
up and down with the convecting water. In the
Labrador Sea over 25 days in February and March
1997 the maximum vertical velocity observed by
the floats was downward at 0.2 m s
91 with a rms
value for all the observations of 0.02 m s
91 , suggesting an average round trip for a parcel of 1 day.
On a number of occasions the floats were seen to
penetrate below the average bottom of the mixing
layer. This suggests that, contrary to the conclusions mentioned above that the convection is not
penetrative, a certain amount of plume penetration
into denser layers does occur. As these floats also
record temperature to within 0.001°C it is possible
to calculate the vertical heat flux through the mixing layer from the difference in the temperature of
the descending water and the ascending water.
5.5.3 Temperature and salinity variability
The previous section discussed some features of
convection that are now better understood because
of time series records obtained during convection.
An additional feature noted in these records is an
increase, during convection, in the amplitude of
temperature and salinity variability. This was
noted by Lilly et al. (1999) in records obtained
from a mooring in the Labrador Sea (Fig. 5.5.5,
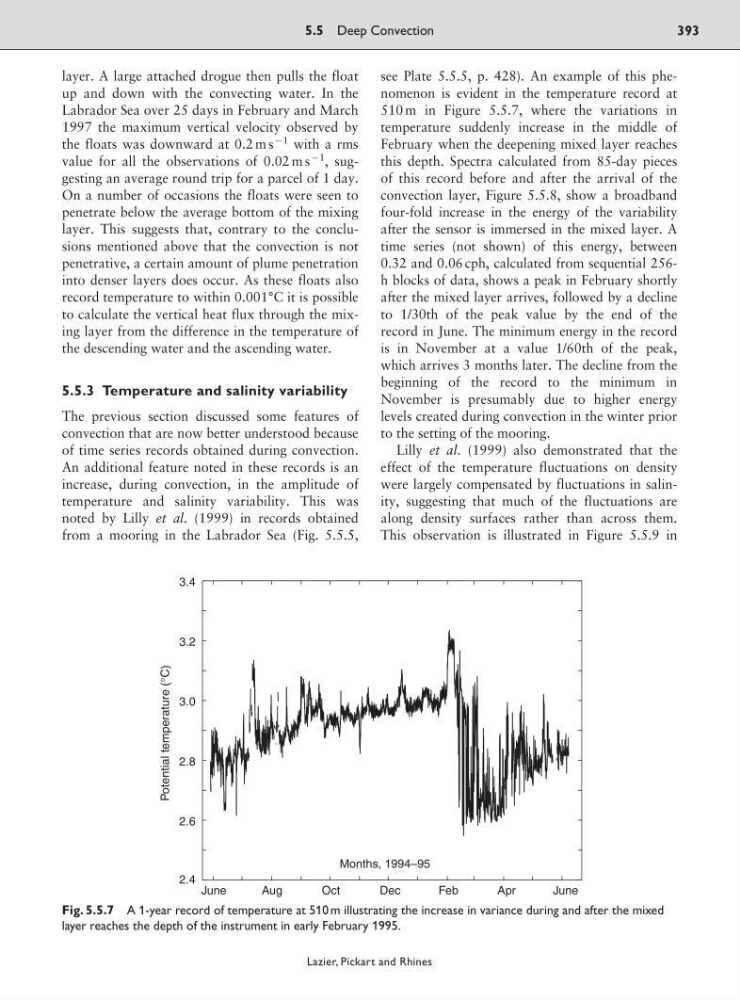
see Plate 5.5.5, p. 428). An example of this phenomenon is evident in the temperature record at
510 m in Figure 5.5.7, where the variations in
temperature suddenly increase in the middle of
February when the deepening mixed layer reaches
this depth. Spectra calculated from 85-day pieces
of this record before and after the arrival of the
convection layer, Figure 5.5.8, show a broadband
four-fold increase in the energy of the variability
after the sensor is immersed in the mixed layer. A
time series (not shown) of this energy, between
0.32 and 0.06 cph, calculated from sequential 256h blocks of data, shows a peak in February shortly
after the mixed layer arrives, followed by a decline
to 1/30th of the peak value by the end of the
record in June. The minimum energy in the record
is in November at a value 1/60th of the peak,
which arrives 3 months later. The decline from the
beginning of the record to the minimum in
November is presumably due to higher energy
levels created during convection in the winter prior
to the setting of the mooring.
Lilly et al. (1999) also demonstrated that the
effect of the temperature fluctuations on density
were largely compensated by fluctuations in salinity, suggesting that much of the fluctuations are
along density surfaces rather than across them.
This observation is illustrated in Figure 5.5.9 in
5.5 Deep Convection
393
Lazier, Pickart and Rhines
June
Aug
Oct
Dec
Feb
Apr
June
2.4
2.6
2.8
3.0
3.2
3.4
Months, 1994–95
Potential temperature (°C)
Fig. 5.5.7 A 1-year record of temperature at 510 m illustrating the increase in variance during and after the mixed
layer reaches the depth of the instrument in early February 1995.
up and down with the convecting water. In the
Labrador Sea over 25 days in February and March
1997 the maximum vertical velocity observed by
the floats was downward at 0.2 m s
91 with a rms
value for all the observations of 0.02 m s
91 , suggesting an average round trip for a parcel of 1 day.
On a number of occasions the floats were seen to
penetrate below the average bottom of the mixing
layer. This suggests that, contrary to the conclusions mentioned above that the convection is not
penetrative, a certain amount of plume penetration
into denser layers does occur. As these floats also
record temperature to within 0.001°C it is possible
to calculate the vertical heat flux through the mixing layer from the difference in the temperature of
the descending water and the ascending water.
5.5.3 Temperature and salinity variability
The previous section discussed some features of
convection that are now better understood because
of time series records obtained during convection.
An additional feature noted in these records is an
increase, during convection, in the amplitude of
temperature and salinity variability. This was
noted by Lilly et al. (1999) in records obtained
from a mooring in the Labrador Sea (Fig. 5.5.5,
see Plate 5.5.5, p. 428). An example of this phenomenon is evident in the temperature record at
510 m in Figure 5.5.7, where the variations in
temperature suddenly increase in the middle of
February when the deepening mixed layer reaches
this depth. Spectra calculated from 85-day pieces
of this record before and after the arrival of the
convection layer, Figure 5.5.8, show a broadband
four-fold increase in the energy of the variability
after the sensor is immersed in the mixed layer. A
time series (not shown) of this energy, between
0.32 and 0.06 cph, calculated from sequential 256h blocks of data, shows a peak in February shortly
after the mixed layer arrives, followed by a decline
to 1/30th of the peak value by the end of the
record in June. The minimum energy in the record
is in November at a value 1/60th of the peak,
which arrives 3 months later. The decline from the
beginning of the record to the minimum in
November is presumably due to higher energy
levels created during convection in the winter prior
to the setting of the mooring.
Lilly et al. (1999) also demonstrated that the
effect of the temperature fluctuations on density
were largely compensated by fluctuations in salinity, suggesting that much of the fluctuations are
along density surfaces rather than across them.
This observation is illustrated in Figure 5.5.9 in
5.5 Deep Convection
393
Lazier, Pickart and Rhines
June
Aug
Oct
Dec
Feb
Apr
June
2.4
2.6
2.8
3.0
3.2
3.4
Months, 1994–95
Potential temperature (°C)
Fig. 5.5.7 A 1-year record of temperature at 510 m illustrating the increase in variance during and after the mixed
layer reaches the depth of the instrument in early February 1995.