

flux is now not great enough to increase noticeably the density and depth of the mixing layer.
The end of convection is indicated in these data
by the sudden decrease in 1.5 at 260 and 510 m at
the end of March. This change indicates the beginning of the restratification process, which is discussed more fully in Section 5.5.3.
When convection is active, water at the surface
becomes denser than the underlying water and
descends in plumes. This water is replaced by
slightly lighter water rising toward the surface. The
physical features of the convecting water including
the plumes and the water between has been the subject of a number of investigations, most notably by
the group of scientists at Kiel working in the Golfe
du Lion in the Mediterranean Sea with moored
Acoustic Doppler Current Profilers (ADCPs) and
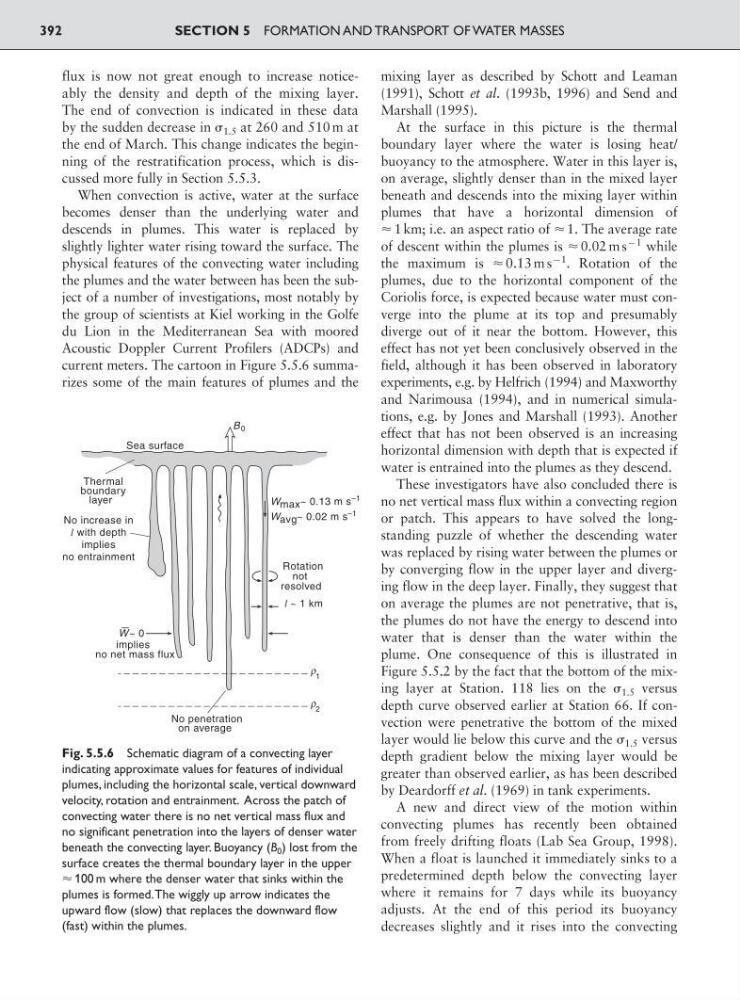
current meters. The cartoon in Figure 5.5.6 summarizes some of the main features of plumes and the
mixing layer as described by Schott and Leaman
(1991), Schott et al. (1993b, 1996) and Send and
Marshall (1995).
At the surface in this picture is the thermal
boundary layer where the water is losing heat/
buoyancy to the atmosphere. Water in this layer is,
on average, slightly denser than in the mixed layer
beneath and descends into the mixing layer within
plumes that have a horizontal dimension of
Ϸ 1 km; i.e. an aspect ratio of Ϸ 1. The average rate
of descent within the plumes is Ϸ 0.02 m s
91 while
the maximum is Ϸ 0.13 m s
91
. Rotation of the
plumes, due to the horizontal component of the
Coriolis force, is expected because water must converge into the plume at its top and presumably
diverge out of it near the bottom. However, this
effect has not yet been conclusively observed in the
field, although it has been observed in laboratory
experiments, e.g. by Helfrich (1994) and Maxworthy
and Narimousa (1994), and in numerical simulations, e.g. by Jones and Marshall (1993). Another
effect that has not been observed is an increasing
horizontal dimension with depth that is expected if
water is entrained into the plumes as they descend.
These investigators have also concluded there is
no net vertical mass flux within a convecting region
or patch. This appears to have solved the longstanding puzzle of whether the descending water
was replaced by rising water between the plumes or
by converging flow in the upper layer and diverging flow in the deep layer. Finally, they suggest that
on average the plumes are not penetrative, that is,
the plumes do not have the energy to descend into
water that is denser than the water within the
plume. One consequence of this is illustrated in
Figure 5.5.2 by the fact that the bottom of the mixing layer at Station. 118 lies on the 1.5 versus
depth curve observed earlier at Station 66. If convection were penetrative the bottom of the mixed
layer would lie below this curve and the 1.5 versus
depth gradient below the mixing layer would be
greater than observed earlier, as has been described
by Deardorff et al. (1969) in tank experiments.
A new and direct view of the motion within
convecting plumes has recently been obtained
from freely drifting floats (Lab Sea Group, 1998).
When a float is launched it immediately sinks to a
predetermined depth below the convecting layer
where it remains for 7 days while its buoyancy
adjusts. At the end of this period its buoyancy
decreases slightly and it rises into the convecting
SECTION 5 FORMATION AND TRANSPORT OF WATER MASSES
392
W~ 0
l ~ 1 km
Thermal
boundary
layer
No increase in
l with depth
implies
no entrainment
implies
no net mass flux
2
Sea surface
Rotation
not
resolved
1
B 0
No penetration
on average
W max ~ 0.13 m s
–1
W avg ~ 0.02 m s
–1
ρ
ρ
Fig. 5.5.6 Schematic diagram of a convecting layer
indicating approximate values for features of individual
plumes, including the horizontal scale, vertical downward
velocity, rotation and entrainment. Across the patch of
convecting water there is no net vertical mass flux and
no significant penetration into the layers of denser water
beneath the convecting layer. Buoyancy (B 0 ) lost from the
surface creates the thermal boundary layer in the upper
Ϸ 100 m where the denser water that sinks within the
plumes is formed.The wiggly up arrow indicates the
upward flow (slow) that replaces the downward flow
(fast) within the plumes.
The end of convection is indicated in these data
by the sudden decrease in 1.5 at 260 and 510 m at
the end of March. This change indicates the beginning of the restratification process, which is discussed more fully in Section 5.5.3.
When convection is active, water at the surface
becomes denser than the underlying water and
descends in plumes. This water is replaced by
slightly lighter water rising toward the surface. The
physical features of the convecting water including
the plumes and the water between has been the subject of a number of investigations, most notably by
the group of scientists at Kiel working in the Golfe
du Lion in the Mediterranean Sea with moored
Acoustic Doppler Current Profilers (ADCPs) and
current meters. The cartoon in Figure 5.5.6 summarizes some of the main features of plumes and the
mixing layer as described by Schott and Leaman
(1991), Schott et al. (1993b, 1996) and Send and
Marshall (1995).
At the surface in this picture is the thermal
boundary layer where the water is losing heat/
buoyancy to the atmosphere. Water in this layer is,
on average, slightly denser than in the mixed layer
beneath and descends into the mixing layer within
plumes that have a horizontal dimension of
Ϸ 1 km; i.e. an aspect ratio of Ϸ 1. The average rate
of descent within the plumes is Ϸ 0.02 m s
91 while
the maximum is Ϸ 0.13 m s
91
. Rotation of the
plumes, due to the horizontal component of the
Coriolis force, is expected because water must converge into the plume at its top and presumably
diverge out of it near the bottom. However, this
effect has not yet been conclusively observed in the
field, although it has been observed in laboratory
experiments, e.g. by Helfrich (1994) and Maxworthy
and Narimousa (1994), and in numerical simulations, e.g. by Jones and Marshall (1993). Another
effect that has not been observed is an increasing
horizontal dimension with depth that is expected if
water is entrained into the plumes as they descend.
These investigators have also concluded there is
no net vertical mass flux within a convecting region
or patch. This appears to have solved the longstanding puzzle of whether the descending water
was replaced by rising water between the plumes or
by converging flow in the upper layer and diverging flow in the deep layer. Finally, they suggest that
on average the plumes are not penetrative, that is,
the plumes do not have the energy to descend into
water that is denser than the water within the
plume. One consequence of this is illustrated in
Figure 5.5.2 by the fact that the bottom of the mixing layer at Station. 118 lies on the 1.5 versus
depth curve observed earlier at Station 66. If convection were penetrative the bottom of the mixed
layer would lie below this curve and the 1.5 versus
depth gradient below the mixing layer would be
greater than observed earlier, as has been described
by Deardorff et al. (1969) in tank experiments.
A new and direct view of the motion within
convecting plumes has recently been obtained
from freely drifting floats (Lab Sea Group, 1998).
When a float is launched it immediately sinks to a
predetermined depth below the convecting layer
where it remains for 7 days while its buoyancy
adjusts. At the end of this period its buoyancy
decreases slightly and it rises into the convecting
SECTION 5 FORMATION AND TRANSPORT OF WATER MASSES
392
W~ 0
l ~ 1 km
Thermal
boundary
layer
No increase in
l with depth
implies
no entrainment
implies
no net mass flux
2
Sea surface
Rotation
not
resolved
1
B 0
No penetration
on average
W max ~ 0.13 m s
–1
W avg ~ 0.02 m s
–1
ρ
ρ
Fig. 5.5.6 Schematic diagram of a convecting layer
indicating approximate values for features of individual
plumes, including the horizontal scale, vertical downward
velocity, rotation and entrainment. Across the patch of
convecting water there is no net vertical mass flux and
no significant penetration into the layers of denser water
beneath the convecting layer. Buoyancy (B 0 ) lost from the
surface creates the thermal boundary layer in the upper
Ϸ 100 m where the denser water that sinks within the
plumes is formed.The wiggly up arrow indicates the
upward flow (slow) that replaces the downward flow
(fast) within the plumes.