

8 years. The anomaly amplitude was by then reduced
to about 5 m, which is not large compared with
other thermocline variability in the tropics. The
cold anomaly then appeared to spread eastwards
along the equator, and increased in amplitude
somewhat. Schneider et al. (1999a) concluded that
the subduction process provides a time-delayed
connection between the subtropical and tropical
oceans, but that the amplitude of the subtropical
signal is probably not significant when compared
with other thermocline variability generated locally
by wind forcing within the tropics. The phenomenology of tropical–subtropical connections is the
subject of very active research (Liu and Philander,
Chapter 4.4) and the last word on subtropical–
tropical connections is undoubtedly not in.
The anomalies seen in the climatologies are
most evident in the height of isotherms. Thickness
anomalies, i.e. potential vorticity anomalies, had
an amplitude of only a few per cent of the mean
potential vorticity, and were by comparison much
harder to map. The most extensive climatologies
do not include salinity with the same time and
space extent, and so the dynamic height associated
with the height anomalies is not known from
direct observation. Thus their generation mechanism and their intrinsic dynamics, whether they are
passive scalars or baroclinic waves is not evident
from the thermal climatology alone. Schneider
et al. (1999b) used COADS-based surface forcing
fields to make a detailed study of the history of
the upper ocean heat and momentum balance for
the period noted. The upper ocean heat budget
included terms for air–sea heat exchange, entrainment, and horizontal advection by the Ekman
transport. All three terms would tend to be
increased (or decreased) by stronger (or weaker)
than average westerly winds. During the period
1973–76 westerly winds were slightly weakened
over the central North Pacific, and the result was
sea surface warming, most evident in the winters.
Following 1976 there was a period of stronger
than average westerly winds causing enhanced
cooling and the eventual appearance of the late
1970s and early 1980s warm anomaly.
Thermocline-depth thermal anomalies might
also be generated by anomalous Ekman pumping,
which exhibits large year-to-year variability. However, there is no clear correlation with decadal
time scale thermal anomalies and thus Schneider
et al. (1999b) concluded that the central North
Pacific sea surface thermal anomalies appeared to
be generated by local, diabatic surface forcing
associated with variations in the strength of the
westerlies. The occurrence of anomalous westerly
winds in the central North Pacific appeared
to be correlated somewhat with El Niño events.
Thus tropical–subtropical connections through
the atmosphere and ocean may be indirect, multifaceted, and by no means easily sorted out from
observations or models.
These and other observational studies of interannual variability have stimulated theoretical and
experimental research aimed at understanding the
generation and propagation of decadal time scale
thermocline anomalies (Liu and Zhang, 1999;
Huang and Pedlosky, 1999; Inui and Liu, 2001;
SECTION 5 FORMATION AND TRANSPORT OF WATER MASSES
368
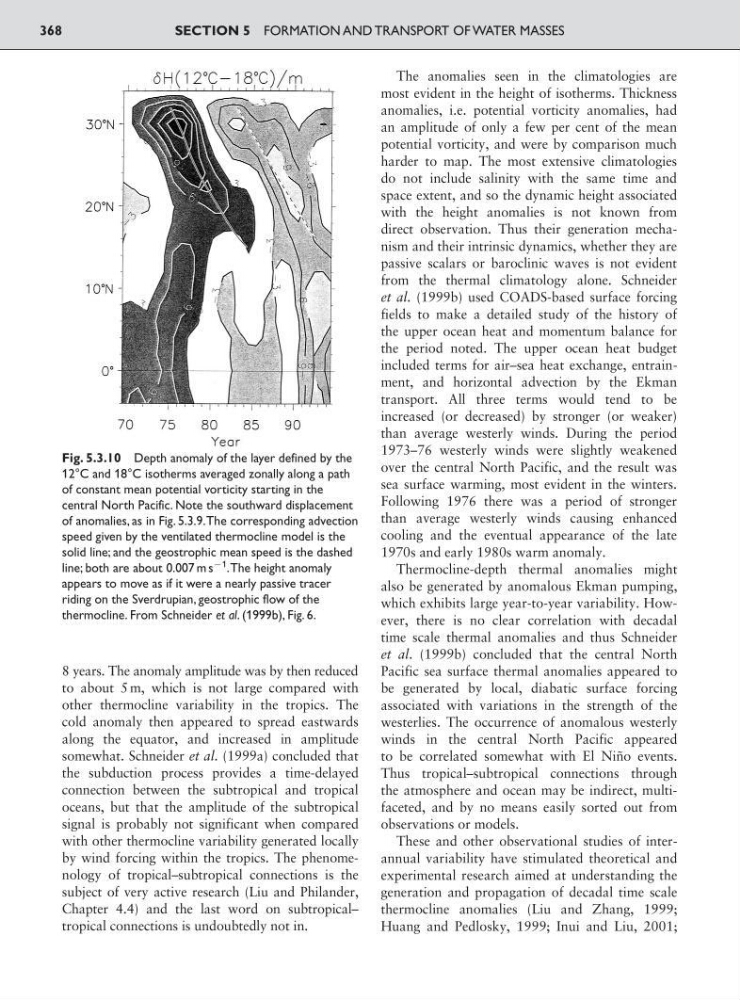
Fig. 5.3.10 Depth anomaly of the layer defined by the
12°C and 18°C isotherms averaged zonally along a path
of constant mean potential vorticity starting in the
central North Pacific. Note the southward displacement
of anomalies, as in Fig. 5.3.9.The corresponding advection
speed given by the ventilated thermocline model is the
solid line; and the geostrophic mean speed is the dashed
line; both are about 0.007 m s
91 .The height anomaly
appears to move as if it were a nearly passive tracer
riding on the Sverdrupian, geostrophic flow of the
thermocline. From Schneider et al. (1999b), Fig. 6.
to about 5 m, which is not large compared with
other thermocline variability in the tropics. The
cold anomaly then appeared to spread eastwards
along the equator, and increased in amplitude
somewhat. Schneider et al. (1999a) concluded that
the subduction process provides a time-delayed
connection between the subtropical and tropical
oceans, but that the amplitude of the subtropical
signal is probably not significant when compared
with other thermocline variability generated locally
by wind forcing within the tropics. The phenomenology of tropical–subtropical connections is the
subject of very active research (Liu and Philander,
Chapter 4.4) and the last word on subtropical–
tropical connections is undoubtedly not in.
The anomalies seen in the climatologies are
most evident in the height of isotherms. Thickness
anomalies, i.e. potential vorticity anomalies, had
an amplitude of only a few per cent of the mean
potential vorticity, and were by comparison much
harder to map. The most extensive climatologies
do not include salinity with the same time and
space extent, and so the dynamic height associated
with the height anomalies is not known from
direct observation. Thus their generation mechanism and their intrinsic dynamics, whether they are
passive scalars or baroclinic waves is not evident
from the thermal climatology alone. Schneider
et al. (1999b) used COADS-based surface forcing
fields to make a detailed study of the history of
the upper ocean heat and momentum balance for
the period noted. The upper ocean heat budget
included terms for air–sea heat exchange, entrainment, and horizontal advection by the Ekman
transport. All three terms would tend to be
increased (or decreased) by stronger (or weaker)
than average westerly winds. During the period
1973–76 westerly winds were slightly weakened
over the central North Pacific, and the result was
sea surface warming, most evident in the winters.
Following 1976 there was a period of stronger
than average westerly winds causing enhanced
cooling and the eventual appearance of the late
1970s and early 1980s warm anomaly.
Thermocline-depth thermal anomalies might
also be generated by anomalous Ekman pumping,
which exhibits large year-to-year variability. However, there is no clear correlation with decadal
time scale thermal anomalies and thus Schneider
et al. (1999b) concluded that the central North
Pacific sea surface thermal anomalies appeared to
be generated by local, diabatic surface forcing
associated with variations in the strength of the
westerlies. The occurrence of anomalous westerly
winds in the central North Pacific appeared
to be correlated somewhat with El Niño events.
Thus tropical–subtropical connections through
the atmosphere and ocean may be indirect, multifaceted, and by no means easily sorted out from
observations or models.
These and other observational studies of interannual variability have stimulated theoretical and
experimental research aimed at understanding the
generation and propagation of decadal time scale
thermocline anomalies (Liu and Zhang, 1999;
Huang and Pedlosky, 1999; Inui and Liu, 2001;
SECTION 5 FORMATION AND TRANSPORT OF WATER MASSES
368
Fig. 5.3.10 Depth anomaly of the layer defined by the
12°C and 18°C isotherms averaged zonally along a path
of constant mean potential vorticity starting in the
central North Pacific. Note the southward displacement
of anomalies, as in Fig. 5.3.9.The corresponding advection
speed given by the ventilated thermocline model is the
solid line; and the geostrophic mean speed is the dashed
line; both are about 0.007 m s
91 .The height anomaly
appears to move as if it were a nearly passive tracer
riding on the Sverdrupian, geostrophic flow of the
thermocline. From Schneider et al. (1999b), Fig. 6.