

with levels below about 200 m not directly connected to the sea surface by an advective path.
An important extension of this analysis was
performed by Schneider et al. (1999b) utilizing
a climatology prepared by White (1995) that
covered the period 1955 to 1996. This data set
showed the late 1970s’ central North Pacific cold
anomaly described in detail by Deser et al. (1996),
as well as a warm anomaly during the period
1973–76 that moved along a similar path and
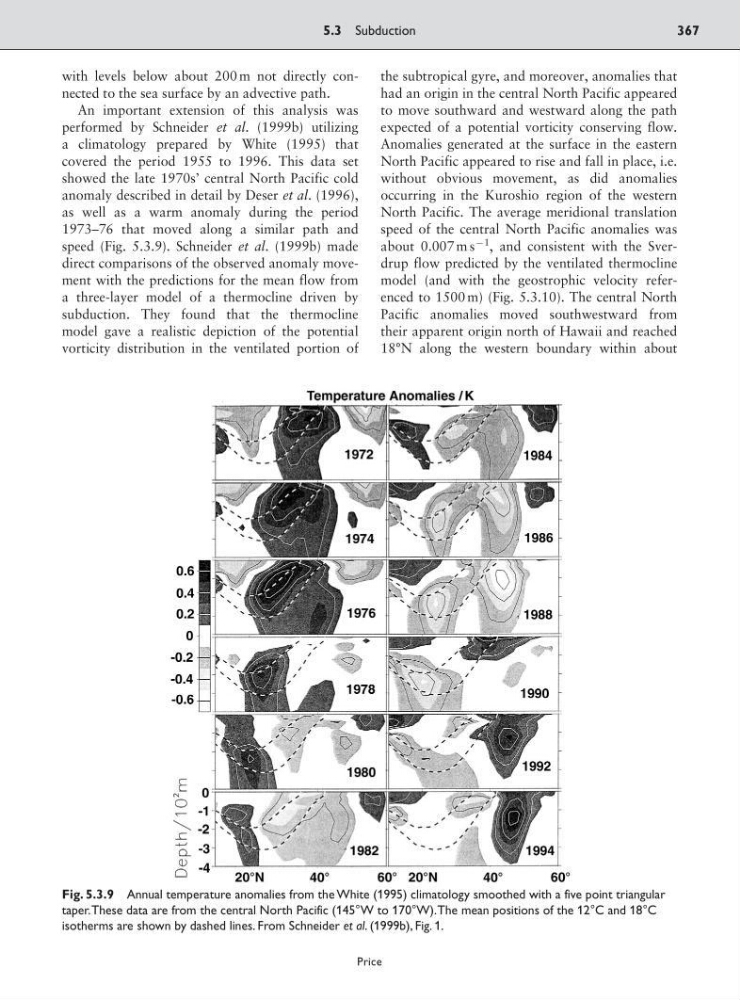
speed (Fig. 5.3.9). Schneider et al. (1999b) made
direct comparisons of the observed anomaly movement with the predictions for the mean flow from
a three-layer model of a thermocline driven by
subduction. They found that the thermocline
model gave a realistic depiction of the potential
vorticity distribution in the ventilated portion of
the subtropical gyre, and moreover, anomalies that
had an origin in the central North Pacific appeared
to move southward and westward along the path
expected of a potential vorticity conserving flow.
Anomalies generated at the surface in the eastern
North Pacific appeared to rise and fall in place, i.e.
without obvious movement, as did anomalies
occurring in the Kuroshio region of the western
North Pacific. The average meridional translation
speed of the central North Pacific anomalies was
about 0.007 m s
91
, and consistent with the Sverdrup flow predicted by the ventilated thermocline
model (and with the geostrophic velocity referenced to 1500 m) (Fig. 5.3.10). The central North
Pacific anomalies moved southwestward from
their apparent origin north of Hawaii and reached
18°N along the western boundary within about
5.3 Subduction
367
Price
Fig. 5.3.9 Annual temperature anomalies from the White (1995) climatology smoothed with a five point triangular
taper.These data are from the central North Pacific (145°W to 170°W).The mean positions of the 12°C and 18°C
isotherms are shown by dashed lines. From Schneider et al. (1999b), Fig. 1.
An important extension of this analysis was
performed by Schneider et al. (1999b) utilizing
a climatology prepared by White (1995) that
covered the period 1955 to 1996. This data set
showed the late 1970s’ central North Pacific cold
anomaly described in detail by Deser et al. (1996),
as well as a warm anomaly during the period
1973–76 that moved along a similar path and
speed (Fig. 5.3.9). Schneider et al. (1999b) made
direct comparisons of the observed anomaly movement with the predictions for the mean flow from
a three-layer model of a thermocline driven by
subduction. They found that the thermocline
model gave a realistic depiction of the potential
vorticity distribution in the ventilated portion of
the subtropical gyre, and moreover, anomalies that
had an origin in the central North Pacific appeared
to move southward and westward along the path
expected of a potential vorticity conserving flow.
Anomalies generated at the surface in the eastern
North Pacific appeared to rise and fall in place, i.e.
without obvious movement, as did anomalies
occurring in the Kuroshio region of the western
North Pacific. The average meridional translation
speed of the central North Pacific anomalies was
about 0.007 m s
91
, and consistent with the Sverdrup flow predicted by the ventilated thermocline
model (and with the geostrophic velocity referenced to 1500 m) (Fig. 5.3.10). The central North
Pacific anomalies moved southwestward from
their apparent origin north of Hawaii and reached
18°N along the western boundary within about
5.3 Subduction
367
Price
Fig. 5.3.9 Annual temperature anomalies from the White (1995) climatology smoothed with a five point triangular
taper.These data are from the central North Pacific (145°W to 170°W).The mean positions of the 12°C and 18°C
isotherms are shown by dashed lines. From Schneider et al. (1999b), Fig. 1.