

variations were well ahead of the ocean observations available at that early stage of ocean science.
Modern data compilations, and most notably the
extensive climatology of upper ocean temperatures
made by Levitus and Boyer (1994b) and by White
(1995) from in-situ sources, are sufficient to reveal
the complex time-dependent response of the North
Pacific Ocean to interdecadal variations of wind
stress and surface heat flux. Deser et al. (1996)
used the former climatology to examine the interannual response of the upper North Pacific (upper
400 m) over the period 1970 to 1991, which
included a significant shift of atmosphere and
ocean climate beginning at around 1976. During
the decadal period from 1977 to 1988 the Aleutian
low was deepened, compared with the period
1971–76 (Fig. 5.3.7a). North Pacific SST was
cooled by about 0.75°C in the western and central
subtropical regions and warmed by about the same
amount along the west coast of North America
(Fig. 5.3.7b). The analysis of this event by Miller
et al. (1994), Deser et al. (1996) and Schneider
et al. (1999b) provides a remarkable view of the
interaction between surface layer anomalies
imposed by the atmosphere and gyre-scale circulation. Theories of subduction have had a central
role in developing the description and understanding of this important climate phenomenon.
The pattern and the amplitude of the SST
anomalies appear to be caused by direct air–sea
interaction (Miller et al., 1994; Inui et al., 1999).
Winters with stronger than normal westerly winds
(the period from 1977 to 1989) produce a cool
SST anomaly, and there is a strong visual correlation between the wind anomaly amplitude and
the SST anomaly amplitude. The surface layer
processes that contribute to the cooling include
enhanced surface heat loss associated with higher
winds, increased vertical mixing associated with
higher winds (and deeper winter mixed-layer
depths), and increased advection by Ekman transport, with stronger westerlies leading to enhanced
cool advection. Whether there is positive or negative feedback between the atmosphere and ocean
as a consequence of this anomaly formation
process is an important question for the future.
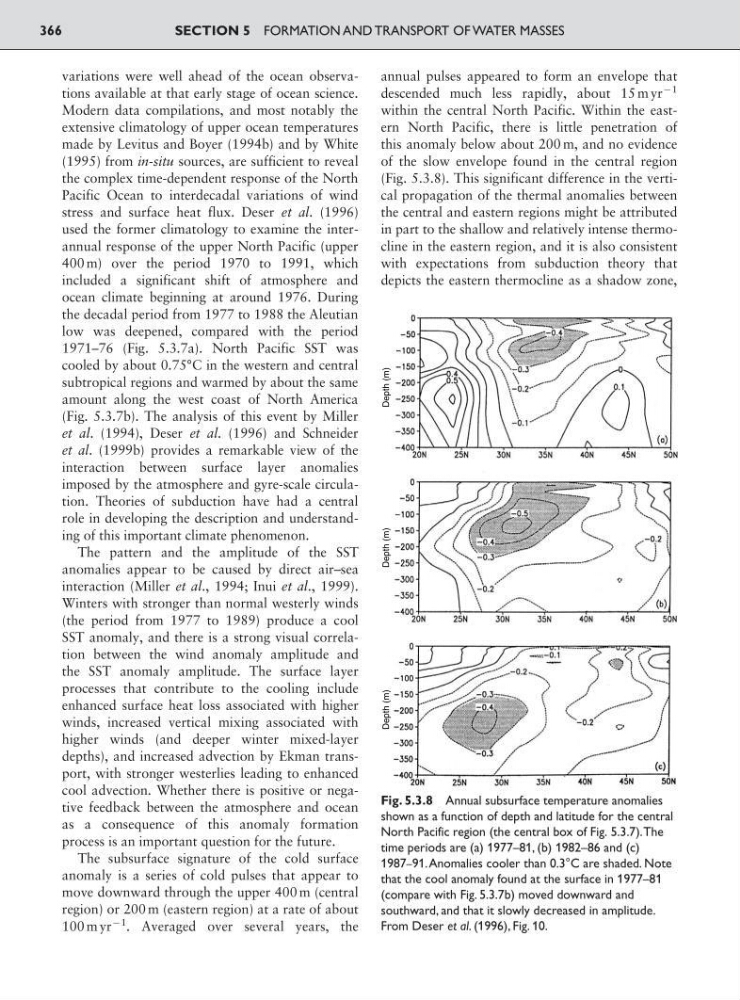
The subsurface signature of the cold surface
anomaly is a series of cold pulses that appear to
move downward through the upper 400 m (central
region) or 200 m (eastern region) at a rate of about
100 m yr
91
. Averaged over several years, the
annual pulses appeared to form an envelope that
descended much less rapidly, about 15 m yr
91
within the central North Pacific. Within the eastern North Pacific, there is little penetration of
this anomaly below about 200 m, and no evidence
of the slow envelope found in the central region
(Fig. 5.3.8). This significant difference in the vertical propagation of the thermal anomalies between
the central and eastern regions might be attributed
in part to the shallow and relatively intense thermocline in the eastern region, and it is also consistent
with expectations from subduction theory that
depicts the eastern thermocline as a shadow zone,
SECTION 5 FORMATION AND TRANSPORT OF WATER MASSES
366
Depth (m)
Depth (m)
Depth (m)
Fig. 5.3.8 Annual subsurface temperature anomalies
shown as a function of depth and latitude for the central
North Pacific region (the central box of Fig. 5.3.7).The
time periods are (a) 1977–81, (b) 1982–86 and (c)
1987–91.Anomalies cooler than 0.3°C are shaded. Note
that the cool anomaly found at the surface in 1977–81
(compare with Fig. 5.3.7b) moved downward and
southward, and that it slowly decreased in amplitude.
From Deser et al. (1996), Fig. 10.
Modern data compilations, and most notably the
extensive climatology of upper ocean temperatures
made by Levitus and Boyer (1994b) and by White
(1995) from in-situ sources, are sufficient to reveal
the complex time-dependent response of the North
Pacific Ocean to interdecadal variations of wind
stress and surface heat flux. Deser et al. (1996)
used the former climatology to examine the interannual response of the upper North Pacific (upper
400 m) over the period 1970 to 1991, which
included a significant shift of atmosphere and
ocean climate beginning at around 1976. During
the decadal period from 1977 to 1988 the Aleutian
low was deepened, compared with the period
1971–76 (Fig. 5.3.7a). North Pacific SST was
cooled by about 0.75°C in the western and central
subtropical regions and warmed by about the same
amount along the west coast of North America
(Fig. 5.3.7b). The analysis of this event by Miller
et al. (1994), Deser et al. (1996) and Schneider
et al. (1999b) provides a remarkable view of the
interaction between surface layer anomalies
imposed by the atmosphere and gyre-scale circulation. Theories of subduction have had a central
role in developing the description and understanding of this important climate phenomenon.
The pattern and the amplitude of the SST
anomalies appear to be caused by direct air–sea
interaction (Miller et al., 1994; Inui et al., 1999).
Winters with stronger than normal westerly winds
(the period from 1977 to 1989) produce a cool
SST anomaly, and there is a strong visual correlation between the wind anomaly amplitude and
the SST anomaly amplitude. The surface layer
processes that contribute to the cooling include
enhanced surface heat loss associated with higher
winds, increased vertical mixing associated with
higher winds (and deeper winter mixed-layer
depths), and increased advection by Ekman transport, with stronger westerlies leading to enhanced
cool advection. Whether there is positive or negative feedback between the atmosphere and ocean
as a consequence of this anomaly formation
process is an important question for the future.
The subsurface signature of the cold surface
anomaly is a series of cold pulses that appear to
move downward through the upper 400 m (central
region) or 200 m (eastern region) at a rate of about
100 m yr
91
. Averaged over several years, the
annual pulses appeared to form an envelope that
descended much less rapidly, about 15 m yr
91
within the central North Pacific. Within the eastern North Pacific, there is little penetration of
this anomaly below about 200 m, and no evidence
of the slow envelope found in the central region
(Fig. 5.3.8). This significant difference in the vertical propagation of the thermal anomalies between
the central and eastern regions might be attributed
in part to the shallow and relatively intense thermocline in the eastern region, and it is also consistent
with expectations from subduction theory that
depicts the eastern thermocline as a shadow zone,
SECTION 5 FORMATION AND TRANSPORT OF WATER MASSES
366
Depth (m)
Depth (m)
Depth (m)
Fig. 5.3.8 Annual subsurface temperature anomalies
shown as a function of depth and latitude for the central
North Pacific region (the central box of Fig. 5.3.7).The
time periods are (a) 1977–81, (b) 1982–86 and (c)
1987–91.Anomalies cooler than 0.3°C are shaded. Note
that the cool anomaly found at the surface in 1977–81
(compare with Fig. 5.3.7b) moved downward and
southward, and that it slowly decreased in amplitude.
From Deser et al. (1996), Fig. 10.