

deeper thermocline where mean flows are weakest
(see also Joyce and Jenkins, 1993; Joyce et al.,
1998).
The DYNAMO Group (DYNAMO Group,
1997) examined the ventilated thermocline and
subduction dynamics in three high-resolution
models of the North Atlantic, each forced by the
same surface fluxes. The models differed with
respect to their vertical discretization and representation of surface layer processes. Despite the
similar surface forcing, the models each developed
a unique pattern of subduction in the subtropics,
and a corresponding, unique potential vorticity
distribution in the upper thermocline. The overall
patterns were not unrealistic, but the interesting
question to consider here is – How could we make
these numerical models better? By better we could
mean either more consistent with North Atlantic
observations, or even just more consistent with
one another. An attempt to answer this question
reveals something significant about the subduction process, namely, that it is not a simple, direct
outcome of a single process or parameterization. Instead, subduction and ventilation in these
comprehensive models are an outcome of the
combined effects of surface layer processes, especially those that determine the depth of the late
winter mixed layer, and the underlying circulation.
Thus, subduction and thermocline ventilation cannot be tuned or improved in a direct and straightforward way, as might be possible with, say, a
parameterization of surface wind stress. Some
examples of model changes that improve aspects
of the circulation are given by Jia (2000), who
showed that inclusion of an entraining Mediterranean outflow greatly improved the simulated
Azores Current in a high-resolution numerical
model (see also New et al., 2000b). Similarly for
upper ocean dynamics, Spall et al. (2000) showed
that gyre-scale advection improved upper ocean
predictions. These improvements may, in addition, have beneficial consequences for subduction and thus for the thermocline circulation and
ventilation.
5.3.4 Transient response of the
thermocline to decadal variability
The first attempts by Wattenberg (Wüst, 1935)
to find the signal of subducting seasonal SST
5.3 Subduction
365
Price
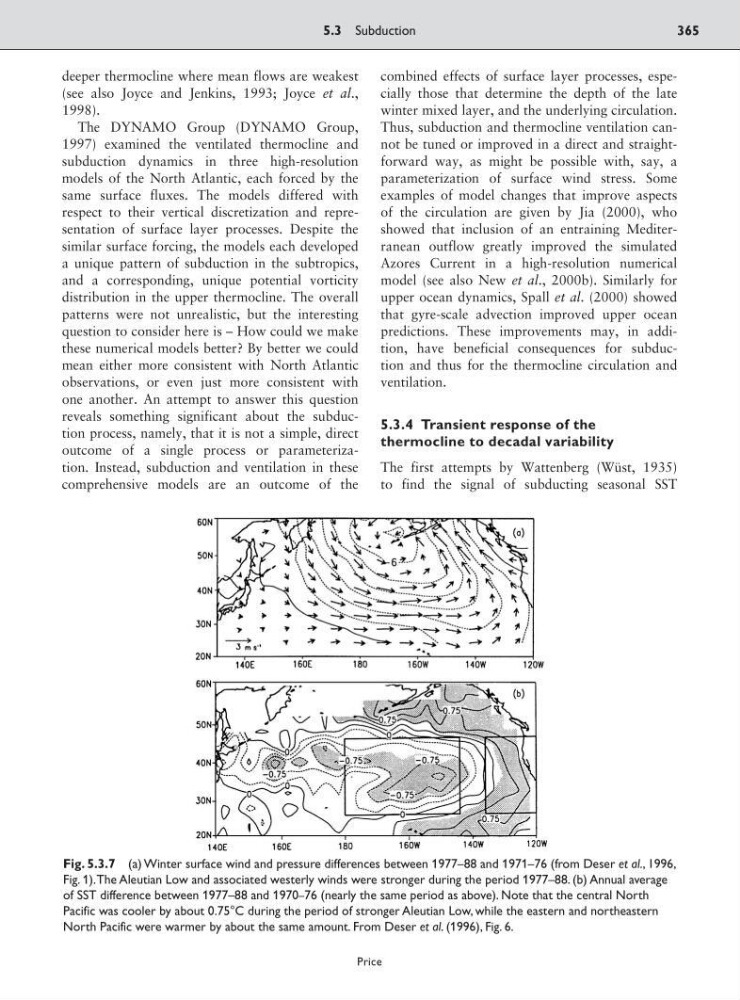
Fig. 5.3.7 (a) Winter surface wind and pressure differences between 1977–88 and 1971–76 (from Deser et al., 1996,
Fig. 1).The Aleutian Low and associated westerly winds were stronger during the period 1977–88. (b) Annual average
of SST difference between 1977–88 and 1970–76 (nearly the same period as above). Note that the central North
Pacific was cooler by about 0.75°C during the period of stronger Aleutian Low, while the eastern and northeastern
North Pacific were warmer by about the same amount. From Deser et al. (1996), Fig. 6.
(see also Joyce and Jenkins, 1993; Joyce et al.,
1998).
The DYNAMO Group (DYNAMO Group,
1997) examined the ventilated thermocline and
subduction dynamics in three high-resolution
models of the North Atlantic, each forced by the
same surface fluxes. The models differed with
respect to their vertical discretization and representation of surface layer processes. Despite the
similar surface forcing, the models each developed
a unique pattern of subduction in the subtropics,
and a corresponding, unique potential vorticity
distribution in the upper thermocline. The overall
patterns were not unrealistic, but the interesting
question to consider here is – How could we make
these numerical models better? By better we could
mean either more consistent with North Atlantic
observations, or even just more consistent with
one another. An attempt to answer this question
reveals something significant about the subduction process, namely, that it is not a simple, direct
outcome of a single process or parameterization. Instead, subduction and ventilation in these
comprehensive models are an outcome of the
combined effects of surface layer processes, especially those that determine the depth of the late
winter mixed layer, and the underlying circulation.
Thus, subduction and thermocline ventilation cannot be tuned or improved in a direct and straightforward way, as might be possible with, say, a
parameterization of surface wind stress. Some
examples of model changes that improve aspects
of the circulation are given by Jia (2000), who
showed that inclusion of an entraining Mediterranean outflow greatly improved the simulated
Azores Current in a high-resolution numerical
model (see also New et al., 2000b). Similarly for
upper ocean dynamics, Spall et al. (2000) showed
that gyre-scale advection improved upper ocean
predictions. These improvements may, in addition, have beneficial consequences for subduction and thus for the thermocline circulation and
ventilation.
5.3.4 Transient response of the
thermocline to decadal variability
The first attempts by Wattenberg (Wüst, 1935)
to find the signal of subducting seasonal SST
5.3 Subduction
365
Price
Fig. 5.3.7 (a) Winter surface wind and pressure differences between 1977–88 and 1971–76 (from Deser et al., 1996,
Fig. 1).The Aleutian Low and associated westerly winds were stronger during the period 1977–88. (b) Annual average
of SST difference between 1977–88 and 1970–76 (nearly the same period as above). Note that the central North
Pacific was cooler by about 0.75°C during the period of stronger Aleutian Low, while the eastern and northeastern
North Pacific were warmer by about the same amount. From Deser et al. (1996), Fig. 6.