

southeast of Greenland where there is a small
region of moderately saline surface water,
͗SSS͘ max 935, combined with cold ͗SST͘ min along
the coast. However, in Baffin Bay such dense
water results from a relative maximum in ͗SSS͘ max
found in January–February, presumably due to ice
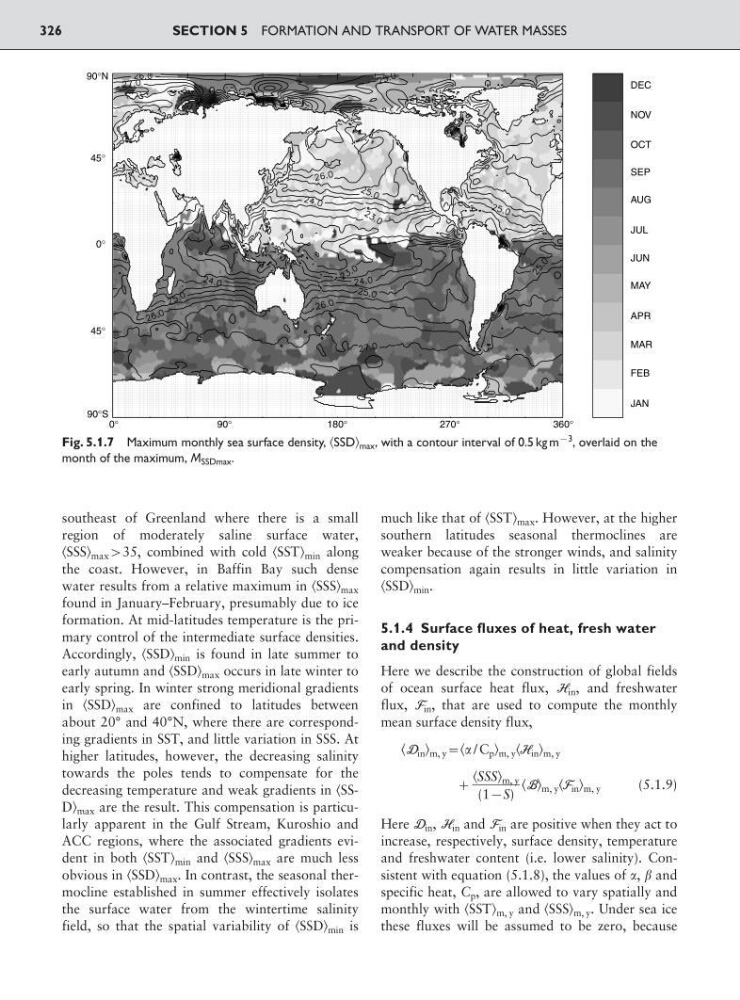
formation. At mid-latitudes temperature is the primary control of the intermediate surface densities.
Accordingly, ͗SSD͘ min is found in late summer to
early autumn and ͗SSD͘ max occurs in late winter to
early spring. In winter strong meridional gradients
in ͗SSD͘ max are confined to latitudes between
about 20° and 40°N, where there are corresponding gradients in SST, and little variation in SSS. At
higher latitudes, however, the decreasing salinity
towards the poles tends to compensate for the
decreasing temperature and weak gradients in ͗SSD͘ max are the result. This compensation is particularly apparent in the Gulf Stream, Kuroshio and
ACC regions, where the associated gradients evident in both ͗SST͘ min and ͗SSS͘ max are much less
obvious in ͗SSD͘ max . In contrast, the seasonal thermocline established in summer effectively isolates
the surface water from the wintertime salinity
field, so that the spatial variability of ͗SSD͘ min is
much like that of ͗SST͘ max . However, at the higher
southern latitudes seasonal thermoclines are
weaker because of the stronger winds, and salinity
compensation again results in little variation in
͗SSD͘ min .
5.1.4 Surface fluxes of heat, fresh water
and density
Here we describe the construction of global fields
of ocean surface heat flux, H in , and freshwater
flux, F in , that are used to compute the monthly
mean surface density flux,
͗D in ͘ m, y :͗ / C p ͘ m, y ͗H in ͘ m, y
;
͗B͘ m, y ͗F in ͘ m, y
(5.1.9)
Here D in , H in and F in are positive when they act to
increase, respectively, surface density, temperature
and freshwater content (i.e. lower salinity). Consistent with equation (5.1.8), the values of , and
specific heat, C p , are allowed to vary spatially and
monthly with ͗SST͘ m, y and ͗SSS͘ m, y . Under sea ice
these fluxes will be assumed to be zero, because
͗SSS͘ m, y
ᎏ
(19S)
SECTION 5 FORMATION AND TRANSPORT OF WATER MASSES
326
90°N
45°
45°
0°
90°S
0°
90°
180°
270°
360°
DEC
NOV
OCT
SEP
AUG
JUL
JUN
MAY
APR
MAR
FEB
JAN
Fig. 5.1.7 Maximum monthly sea surface density, ͗SSD͘ max , with a contour interval of 0.5 kg m
93
, overlaid on the
month of the maximum, M SSDmax .
region of moderately saline surface water,
͗SSS͘ max 935, combined with cold ͗SST͘ min along
the coast. However, in Baffin Bay such dense
water results from a relative maximum in ͗SSS͘ max
found in January–February, presumably due to ice
formation. At mid-latitudes temperature is the primary control of the intermediate surface densities.
Accordingly, ͗SSD͘ min is found in late summer to
early autumn and ͗SSD͘ max occurs in late winter to
early spring. In winter strong meridional gradients
in ͗SSD͘ max are confined to latitudes between
about 20° and 40°N, where there are corresponding gradients in SST, and little variation in SSS. At
higher latitudes, however, the decreasing salinity
towards the poles tends to compensate for the
decreasing temperature and weak gradients in ͗SSD͘ max are the result. This compensation is particularly apparent in the Gulf Stream, Kuroshio and
ACC regions, where the associated gradients evident in both ͗SST͘ min and ͗SSS͘ max are much less
obvious in ͗SSD͘ max . In contrast, the seasonal thermocline established in summer effectively isolates
the surface water from the wintertime salinity
field, so that the spatial variability of ͗SSD͘ min is
much like that of ͗SST͘ max . However, at the higher
southern latitudes seasonal thermoclines are
weaker because of the stronger winds, and salinity
compensation again results in little variation in
͗SSD͘ min .
5.1.4 Surface fluxes of heat, fresh water
and density
Here we describe the construction of global fields
of ocean surface heat flux, H in , and freshwater
flux, F in , that are used to compute the monthly
mean surface density flux,
͗D in ͘ m, y :͗ / C p ͘ m, y ͗H in ͘ m, y
;
͗B͘ m, y ͗F in ͘ m, y
(5.1.9)
Here D in , H in and F in are positive when they act to
increase, respectively, surface density, temperature
and freshwater content (i.e. lower salinity). Consistent with equation (5.1.8), the values of , and
specific heat, C p , are allowed to vary spatially and
monthly with ͗SST͘ m, y and ͗SSS͘ m, y . Under sea ice
these fluxes will be assumed to be zero, because
͗SSS͘ m, y
ᎏ
(19S)
SECTION 5 FORMATION AND TRANSPORT OF WATER MASSES
326
90°N
45°
45°
0°
90°S
0°
90°
180°
270°
360°
DEC
NOV
OCT
SEP
AUG
JUL
JUN
MAY
APR
MAR
FEB
JAN
Fig. 5.1.7 Maximum monthly sea surface density, ͗SSD͘ max , with a contour interval of 0.5 kg m
93
, overlaid on the
month of the maximum, M SSDmax .