

SSS͘ max :34<0.5 and ͗SSS͘ min :33.5<0.5; and
the Gulf Stream by both ͗SSS͘ max and ͗SSS͘ min
between about 33 and 36.
5.1.3.3 Sea surface density, SSD
A monthly mean sea surface density is computed
from the equation of state, :(T, S), as
͗SSD͘ m, y :(͗SST͘ m, y ,͗SSS͘ m )
(5.1.8)
Since in general this is not equal to the mean of the
density, this is another weakness of this study
imposed by the limits of the WOCE data sets.
However, use of equation (5.1.8) is equivalent to
linearization about the monthly mean SST and SSS
at each point with appropriate thermal and haline
expansion coefficients. This is preferred over the
common oceanographic practice of linearizing
about fixed reference SST and SSS with invariant
coefficients.
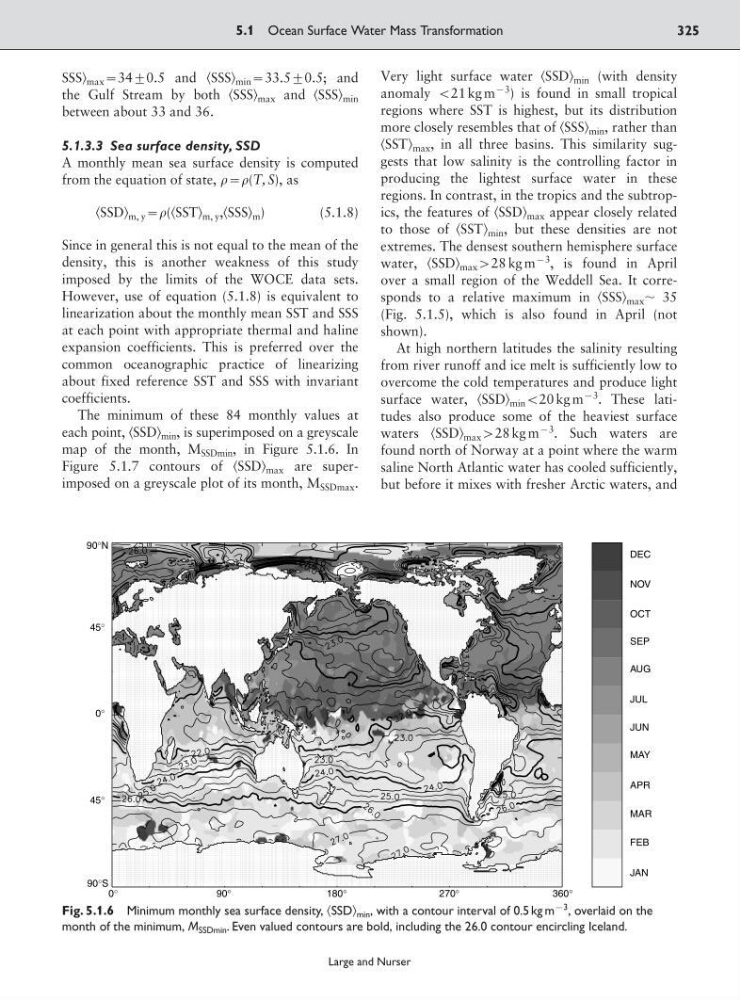
The minimum of these 84 monthly values at
each point, ͗SSD͘ min , is superimposed on a greyscale
map of the month, M SSDmin , in Figure 5.1.6. In
Figure 5.1.7 contours of ͗SSD͘ max are superimposed on a greyscale plot of its month, M SSDmax .
Very light surface water ͗SSD͘ min (with density
anomaly :21 kg m
93
) is found in small tropical
regions where SST is highest, but its distribution
more closely resembles that of ͗SSS͘ min , rather than
͗SST͘ max , in all three basins. This similarity suggests that low salinity is the controlling factor in
producing the lightest surface water in these
regions. In contrast, in the tropics and the subtropics, the features of ͗SSD͘ max appear closely related
to those of ͗SST͘ min , but these densities are not
extremes. The densest southern hemisphere surface
water, ͗SSD͘ max 928 kg m
93
, is found in April
over a small region of the Weddell Sea. It corresponds to a relative maximum in ͗SSS͘ max ϳ 35
(Fig. 5.1.5), which is also found in April (not
shown).
At high northern latitudes the salinity resulting
from river runoff and ice melt is sufficiently low to
overcome the cold temperatures and produce light
surface water, ͗SSD͘ min :20 kg m
93
. These latitudes also produce some of the heaviest surface
waters ͗SSD͘ max 928 kg m
93
. Such waters are
found north of Norway at a point where the warm
saline North Atlantic water has cooled sufficiently,
but before it mixes with fresher Arctic waters, and
5.1 Ocean Surface Water Mass Transformation
325
Large and Nurser
90°N
45°
45°
0°
90°S
0°
90°
180°
270°
360°
DEC
NOV
OCT
SEP
AUG
JUL
JUN
MAY
APR
MAR
FEB
JAN
Fig. 5.1.6 Minimum monthly sea surface density, ͗SSD͘ min , with a contour interval of 0.5 kg m
93
, overlaid on the
month of the minimum, M SSDmin . Even valued contours are bold, including the 26.0 contour encircling Iceland.
the Gulf Stream by both ͗SSS͘ max and ͗SSS͘ min
between about 33 and 36.
5.1.3.3 Sea surface density, SSD
A monthly mean sea surface density is computed
from the equation of state, :(T, S), as
͗SSD͘ m, y :(͗SST͘ m, y ,͗SSS͘ m )
(5.1.8)
Since in general this is not equal to the mean of the
density, this is another weakness of this study
imposed by the limits of the WOCE data sets.
However, use of equation (5.1.8) is equivalent to
linearization about the monthly mean SST and SSS
at each point with appropriate thermal and haline
expansion coefficients. This is preferred over the
common oceanographic practice of linearizing
about fixed reference SST and SSS with invariant
coefficients.
The minimum of these 84 monthly values at
each point, ͗SSD͘ min , is superimposed on a greyscale
map of the month, M SSDmin , in Figure 5.1.6. In
Figure 5.1.7 contours of ͗SSD͘ max are superimposed on a greyscale plot of its month, M SSDmax .
Very light surface water ͗SSD͘ min (with density
anomaly :21 kg m
93
) is found in small tropical
regions where SST is highest, but its distribution
more closely resembles that of ͗SSS͘ min , rather than
͗SST͘ max , in all three basins. This similarity suggests that low salinity is the controlling factor in
producing the lightest surface water in these
regions. In contrast, in the tropics and the subtropics, the features of ͗SSD͘ max appear closely related
to those of ͗SST͘ min , but these densities are not
extremes. The densest southern hemisphere surface
water, ͗SSD͘ max 928 kg m
93
, is found in April
over a small region of the Weddell Sea. It corresponds to a relative maximum in ͗SSS͘ max ϳ 35
(Fig. 5.1.5), which is also found in April (not
shown).
At high northern latitudes the salinity resulting
from river runoff and ice melt is sufficiently low to
overcome the cold temperatures and produce light
surface water, ͗SSD͘ min :20 kg m
93
. These latitudes also produce some of the heaviest surface
waters ͗SSD͘ max 928 kg m
93
. Such waters are
found north of Norway at a point where the warm
saline North Atlantic water has cooled sufficiently,
but before it mixes with fresher Arctic waters, and
5.1 Ocean Surface Water Mass Transformation
325
Large and Nurser
90°N
45°
45°
0°
90°S
0°
90°
180°
270°
360°
DEC
NOV
OCT
SEP
AUG
JUL
JUN
MAY
APR
MAR
FEB
JAN
Fig. 5.1.6 Minimum monthly sea surface density, ͗SSD͘ min , with a contour interval of 0.5 kg m
93
, overlaid on the
month of the minimum, M SSDmin . Even valued contours are bold, including the 26.0 contour encircling Iceland.