

seas ͗SST͘ min is less than 90.5°C. At most
points in the northern hemisphere the minimum
SST is in February or March, but it occurs as early
as January in the tropical Pacific and Indian
Oceans, and as late as April in the North Atlantic
and Pacific Oceans. Conversely, most minima in
the southern hemisphere occur in August and
September, with some in June and July. Along the
equatorial Pacific the minimum occurs systematically later in the year from September at 250°E to
April at 170°E. This progression marks the development of the cold tongue.
There is no significant correlation between the
years of maximum SST, Y SSTmax , and of minimum
SST, Y SSTmin , indicating that the year in which a
point has its maximum SST is unlikely to be the
year in which it has its minimum. The year 1997
appears to have been relatively warm in that there
are large areas of Y SSTmax :1997, but few with
Y SSTmin :1997. The coldest years in the central
equatorial Pacific were 1995 and 1996. There does
not appear to be any systematic propagation
of either ͗SST͘ min or ͗SST͘ max along the routes of
the major current systems. For example, in
the Pacific sector of the ACC, Y SSTmax following
the flow direction is 1992 (180–250°E), 1995
(250–275°E), 1993 (275–290°E), and 1997 (290–
300°E).
5.1.3.2 Sea surface salinity, SSS
Unlike SST, near surface salinity has never been
measured monthly on basin scales. However, there
are mean monthly climatologies of ͗SSS͘ m . We use
that of Levitus et al. (1994) updated to 1998
(Levitus et al., 1998), which gives global maps for
each month of salinity at standard depths. We are
forced to assume that the surface climatologies,
͗SSS͘ m , are representative of the monthly average
SSS for month m in each of the seven WOCE
years. This assumption may be more valid in some
regions than others, but is clearly a weakness in
the WOCE data set and this study. Nevertheless,
the global distributions of both the maximum,
͗SSS͘ max , and minimum, ͗SSS͘ min , are shown in
Figure 5.1.5. Values less than 30 are usually associated with river runoff into coastal regions or
enclosed seas, and/or with melting sea ice and are
not contoured, nor are values greater than 38,
which are found in enclosed regions of high evaporation, such as the Mediterranean and Red Seas.
5.1 Ocean Surface Water Mass Transformation
323
Large and Nurser
ττ
90°N
45°
45°
0°
90°S
0°
90°
180°
270°
360°
DEC
NOV
OCT
SEP
AUG
JUL
JUN
MAY
APR
MAR
FEB
JAN
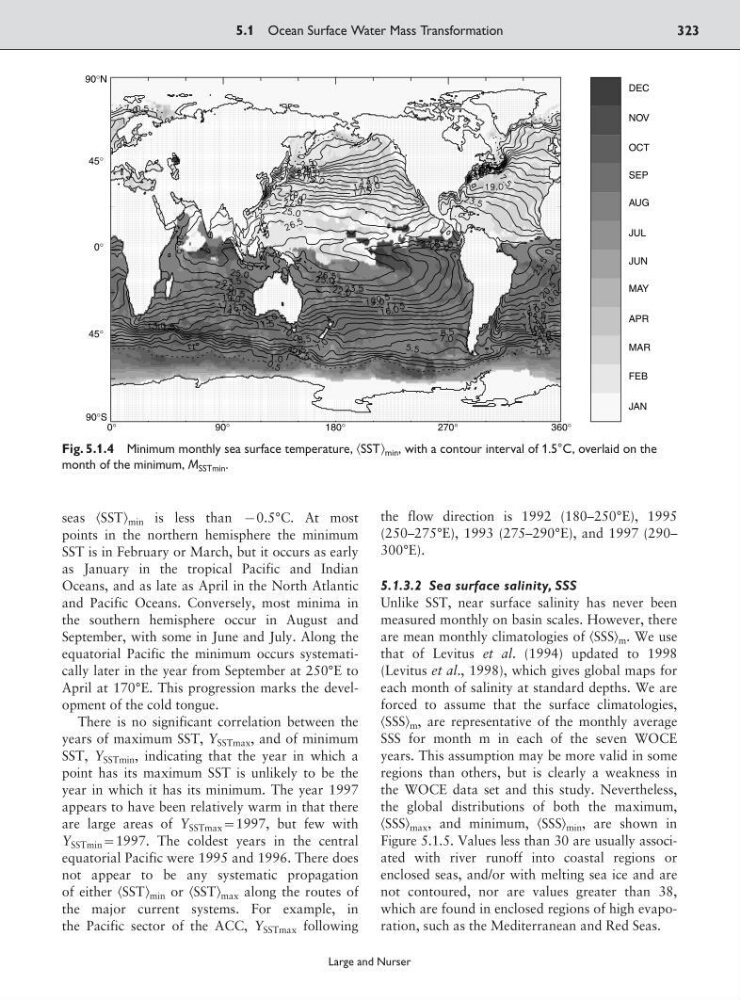
Fig. 5.1.4 Minimum monthly sea surface temperature, ͗SST͘ min , with a contour interval of 1.5°C, overlaid on the
month of the minimum, M SSTmin .
points in the northern hemisphere the minimum
SST is in February or March, but it occurs as early
as January in the tropical Pacific and Indian
Oceans, and as late as April in the North Atlantic
and Pacific Oceans. Conversely, most minima in
the southern hemisphere occur in August and
September, with some in June and July. Along the
equatorial Pacific the minimum occurs systematically later in the year from September at 250°E to
April at 170°E. This progression marks the development of the cold tongue.
There is no significant correlation between the
years of maximum SST, Y SSTmax , and of minimum
SST, Y SSTmin , indicating that the year in which a
point has its maximum SST is unlikely to be the
year in which it has its minimum. The year 1997
appears to have been relatively warm in that there
are large areas of Y SSTmax :1997, but few with
Y SSTmin :1997. The coldest years in the central
equatorial Pacific were 1995 and 1996. There does
not appear to be any systematic propagation
of either ͗SST͘ min or ͗SST͘ max along the routes of
the major current systems. For example, in
the Pacific sector of the ACC, Y SSTmax following
the flow direction is 1992 (180–250°E), 1995
(250–275°E), 1993 (275–290°E), and 1997 (290–
300°E).
5.1.3.2 Sea surface salinity, SSS
Unlike SST, near surface salinity has never been
measured monthly on basin scales. However, there
are mean monthly climatologies of ͗SSS͘ m . We use
that of Levitus et al. (1994) updated to 1998
(Levitus et al., 1998), which gives global maps for
each month of salinity at standard depths. We are
forced to assume that the surface climatologies,
͗SSS͘ m , are representative of the monthly average
SSS for month m in each of the seven WOCE
years. This assumption may be more valid in some
regions than others, but is clearly a weakness in
the WOCE data set and this study. Nevertheless,
the global distributions of both the maximum,
͗SSS͘ max , and minimum, ͗SSS͘ min , are shown in
Figure 5.1.5. Values less than 30 are usually associated with river runoff into coastal regions or
enclosed seas, and/or with melting sea ice and are
not contoured, nor are values greater than 38,
which are found in enclosed regions of high evaporation, such as the Mediterranean and Red Seas.
5.1 Ocean Surface Water Mass Transformation
323
Large and Nurser
ττ
90°N
45°
45°
0°
90°S
0°
90°
180°
270°
360°
DEC
NOV
OCT
SEP
AUG
JUL
JUN
MAY
APR
MAR
FEB
JAN
Fig. 5.1.4 Minimum monthly sea surface temperature, ͗SST͘ min , with a contour interval of 1.5°C, overlaid on the
month of the minimum, M SSTmin .