

to 1997 is the year. There are 84 such values at
each point of on 2°2° global grid.
We are interested in extrema in sea surface density (SSD), and whether or not these result from
corresponding extrema in sea surface temperature
(SST) and/or sea surface salinity (SSS). Therefore,
monthly data sets are searched for the months and
years of maxima and minima of SST, SSS and SSD.
Note that the months of extrema may not correspond to the phase of the annual harmonic in
regions where there is higher frequency variability,
such as a significant semiannual harmonic. In
particular a maximum and minimum need not be
separated by exactly 6 months. From the 84 values
of ͗SST͘ m,y the maximum, ͗SST͘ max , as well
as the month, M SSTmax and year Y SSTmax , of the
maximum were determined. The month, M SSTmin ,
year, Y SSTmin , and minimum, ͗SST͘ min were found
similarly.
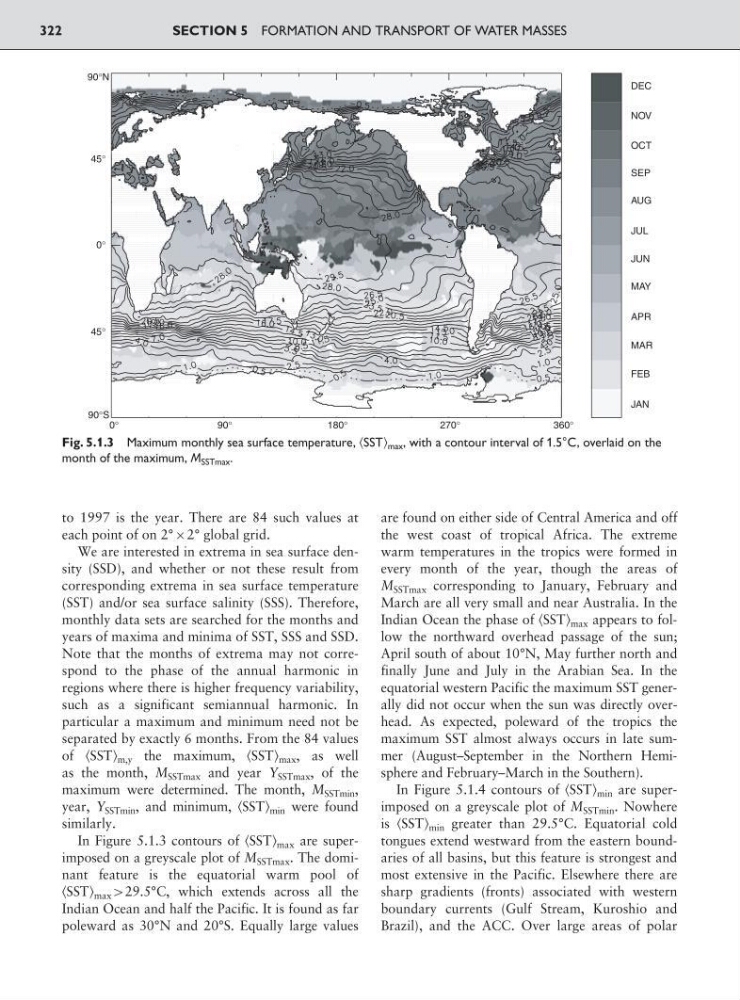
In Figure 5.1.3 contours of ͗SST͘ max are superimposed on a greyscale plot of M SSTmax . The dominant feature is the equatorial warm pool of
͗SST͘ max 929.5°C, which extends across all the
Indian Ocean and half the Pacific. It is found as far
poleward as 30°N and 20°S. Equally large values
are found on either side of Central America and off
the west coast of tropical Africa. The extreme
warm temperatures in the tropics were formed in
every month of the year, though the areas of
M SSTmax corresponding to January, February and
March are all very small and near Australia. In the
Indian Ocean the phase of ͗SST͘ max appears to follow the northward overhead passage of the sun;
April south of about 10°N, May further north and
finally June and July in the Arabian Sea. In the
equatorial western Pacific the maximum SST generally did not occur when the sun was directly overhead. As expected, poleward of the tropics the
maximum SST almost always occurs in late summer (August–September in the Northern Hemisphere and February–March in the Southern).
In Figure 5.1.4 contours of ͗SST͘ min are superimposed on a greyscale plot of M SSTmin . Nowhere
is ͗SST͘ min greater than 29.5°C. Equatorial cold
tongues extend westward from the eastern boundaries of all basins, but this feature is strongest and
most extensive in the Pacific. Elsewhere there are
sharp gradients (fronts) associated with western
boundary currents (Gulf Stream, Kuroshio and
Brazil), and the ACC. Over large areas of polar
SECTION 5 FORMATION AND TRANSPORT OF WATER MASSES
322
90°N
45°
45°
0°
90°S
0°
90°
180°
270°
360°
DEC
NOV
OCT
SEP
AUG
JUL
JUN
MAY
APR
MAR
FEB
JAN
Fig. 5.1.3 Maximum monthly sea surface temperature, ͗SST͘ max , with a contour interval of 1.5°C, overlaid on the
month of the maximum, M SSTmax .
each point of on 2°2° global grid.
We are interested in extrema in sea surface density (SSD), and whether or not these result from
corresponding extrema in sea surface temperature
(SST) and/or sea surface salinity (SSS). Therefore,
monthly data sets are searched for the months and
years of maxima and minima of SST, SSS and SSD.
Note that the months of extrema may not correspond to the phase of the annual harmonic in
regions where there is higher frequency variability,
such as a significant semiannual harmonic. In
particular a maximum and minimum need not be
separated by exactly 6 months. From the 84 values
of ͗SST͘ m,y the maximum, ͗SST͘ max , as well
as the month, M SSTmax and year Y SSTmax , of the
maximum were determined. The month, M SSTmin ,
year, Y SSTmin , and minimum, ͗SST͘ min were found
similarly.
In Figure 5.1.3 contours of ͗SST͘ max are superimposed on a greyscale plot of M SSTmax . The dominant feature is the equatorial warm pool of
͗SST͘ max 929.5°C, which extends across all the
Indian Ocean and half the Pacific. It is found as far
poleward as 30°N and 20°S. Equally large values
are found on either side of Central America and off
the west coast of tropical Africa. The extreme
warm temperatures in the tropics were formed in
every month of the year, though the areas of
M SSTmax corresponding to January, February and
March are all very small and near Australia. In the
Indian Ocean the phase of ͗SST͘ max appears to follow the northward overhead passage of the sun;
April south of about 10°N, May further north and
finally June and July in the Arabian Sea. In the
equatorial western Pacific the maximum SST generally did not occur when the sun was directly overhead. As expected, poleward of the tropics the
maximum SST almost always occurs in late summer (August–September in the Northern Hemisphere and February–March in the Southern).
In Figure 5.1.4 contours of ͗SST͘ min are superimposed on a greyscale plot of M SSTmin . Nowhere
is ͗SST͘ min greater than 29.5°C. Equatorial cold
tongues extend westward from the eastern boundaries of all basins, but this feature is strongest and
most extensive in the Pacific. Elsewhere there are
sharp gradients (fronts) associated with western
boundary currents (Gulf Stream, Kuroshio and
Brazil), and the ACC. Over large areas of polar
SECTION 5 FORMATION AND TRANSPORT OF WATER MASSES
322
90°N
45°
45°
0°
90°S
0°
90°
180°
270°
360°
DEC
NOV
OCT
SEP
AUG
JUL
JUN
MAY
APR
MAR
FEB
JAN
Fig. 5.1.3 Maximum monthly sea surface temperature, ͗SST͘ max , with a contour interval of 1.5°C, overlaid on the
month of the maximum, M SSTmax .