

computed by Johnson et al. (1994a) and Freeland
(2001) from hydrographic section data and the
application of a 1.2°C reference surface.
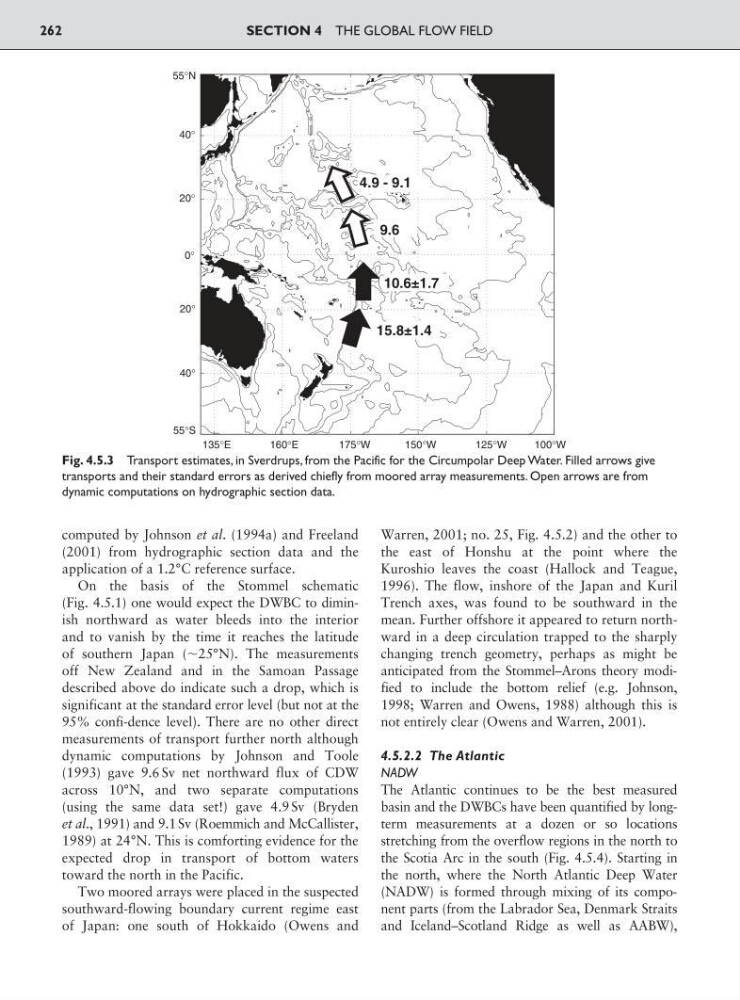
On the basis of the Stommel schematic
(Fig. 4.5.1) one would expect the DWBC to diminish northward as water bleeds into the interior
and to vanish by the time it reaches the latitude
of southern Japan (ϳ25°N). The measurements
off New Zealand and in the Samoan Passage
described above do indicate such a drop, which is
significant at the standard error level (but not at the
95% confi-dence level). There are no other direct
measurements of transport further north although
dynamic computations by Johnson and Toole
(1993) gave 9.6 Sv net northward flux of CDW
across 10°N, and two separate computations
(using the same data set!) gave 4.9 Sv (Bryden
et al., 1991) and 9.1 Sv (Roemmich and McCallister,
1989) at 24°N. This is comforting evidence for the
expected drop in transport of bottom waters
toward the north in the Pacific.
Two moored arrays were placed in the suspected
southward-flowing boundary current regime east
of Japan: one south of Hokkaido (Owens and
Warren, 2001; no. 25, Fig. 4.5.2) and the other to
the east of Honshu at the point where the
Kuroshio leaves the coast (Hallock and Teague,
1996). The flow, inshore of the Japan and Kuril
Trench axes, was found to be southward in the
mean. Further offshore it appeared to return northward in a deep circulation trapped to the sharply
changing trench geometry, perhaps as might be
anticipated from the Stommel–Arons theory modified to include the bottom relief (e.g. Johnson,
1998; Warren and Owens, 1988) although this is
not entirely clear (Owens and Warren, 2001).
4.5.2.2 The Atlantic
NADW
The Atlantic continues to be the best measured
basin and the DWBCs have been quantified by longterm measurements at a dozen or so locations
stretching from the overflow regions in the north to
the Scotia Arc in the south (Fig. 4.5.4). Starting in
the north, where the North Atlantic Deep Water
(NADW) is formed through mixing of its component parts (from the Labrador Sea, Denmark Straits
and Iceland–Scotland Ridge as well as AABW),
SECTION 4 THE GLOBAL FLOW FIELD
262
4.9 - 9.1
10.6±1.7
15.8±1.4
9.6
55°N
55°S
40°
40°
20°
20°
0°
135°E
160°E
175°W
150°W
125°W
100°W
Fig. 4.5.3 Transport estimates, in Sverdrups, from the Pacific for the Circumpolar Deep Water. Filled arrows give
transports and their standard errors as derived chiefly from moored array measurements. Open arrows are from
dynamic computations on hydrographic section data.
(2001) from hydrographic section data and the
application of a 1.2°C reference surface.
On the basis of the Stommel schematic
(Fig. 4.5.1) one would expect the DWBC to diminish northward as water bleeds into the interior
and to vanish by the time it reaches the latitude
of southern Japan (ϳ25°N). The measurements
off New Zealand and in the Samoan Passage
described above do indicate such a drop, which is
significant at the standard error level (but not at the
95% confi-dence level). There are no other direct
measurements of transport further north although
dynamic computations by Johnson and Toole
(1993) gave 9.6 Sv net northward flux of CDW
across 10°N, and two separate computations
(using the same data set!) gave 4.9 Sv (Bryden
et al., 1991) and 9.1 Sv (Roemmich and McCallister,
1989) at 24°N. This is comforting evidence for the
expected drop in transport of bottom waters
toward the north in the Pacific.
Two moored arrays were placed in the suspected
southward-flowing boundary current regime east
of Japan: one south of Hokkaido (Owens and
Warren, 2001; no. 25, Fig. 4.5.2) and the other to
the east of Honshu at the point where the
Kuroshio leaves the coast (Hallock and Teague,
1996). The flow, inshore of the Japan and Kuril
Trench axes, was found to be southward in the
mean. Further offshore it appeared to return northward in a deep circulation trapped to the sharply
changing trench geometry, perhaps as might be
anticipated from the Stommel–Arons theory modified to include the bottom relief (e.g. Johnson,
1998; Warren and Owens, 1988) although this is
not entirely clear (Owens and Warren, 2001).
4.5.2.2 The Atlantic
NADW
The Atlantic continues to be the best measured
basin and the DWBCs have been quantified by longterm measurements at a dozen or so locations
stretching from the overflow regions in the north to
the Scotia Arc in the south (Fig. 4.5.4). Starting in
the north, where the North Atlantic Deep Water
(NADW) is formed through mixing of its component parts (from the Labrador Sea, Denmark Straits
and Iceland–Scotland Ridge as well as AABW),
SECTION 4 THE GLOBAL FLOW FIELD
262
4.9 - 9.1
10.6±1.7
15.8±1.4
9.6
55°N
55°S
40°
40°
20°
20°
0°
135°E
160°E
175°W
150°W
125°W
100°W
Fig. 4.5.3 Transport estimates, in Sverdrups, from the Pacific for the Circumpolar Deep Water. Filled arrows give
transports and their standard errors as derived chiefly from moored array measurements. Open arrows are from
dynamic computations on hydrographic section data.