

Saunders (1996; no. 2, Fig. 4.5.2) estimated that
3.2<0.5 Sv of water with 927.8 kg m
93 flows
southward along the eastern flank of the MidAtlantic Ridge toward the Charlie-Gibbs Fracture
Zone at 53°N, where he found that 2.4<0.5 Sv
continues westward into the western basin
(Saunders, 1994). Surely the prize for the most
ambitious attempt at measuring DWBC flows goes
to the Dickson and Brown (1994; no. 1, Fig. 4.5.2)
(see also Dickson et al., 1990) effort downstream of
the Denmark Straits. Here some 96 instruments
were deployed on three sections across the current.
Although the maximum deployment period was
about 1 year, the main ‘Angmagssalik’ array was
set three times to give an almost unbroken 3-year
record. Total transport of dense water (again,
927.8 kg m
93
) was found to be 10.7 Sv at this
site, a substantial increase over that believed to be
coming through the Straits. Unfortunately, no estimate of error or variance was given but the authors
stated that the variance was comparable to the
energy in the mean and the time scales were short,
of less than 10 days, so the error must be just a
fraction of a Sverdrup. Summing the two northern
4.5 Quantification of the Deep Circulation
263
Hogg
50°N
25°
0°
25°
50°S
80°W
6 0 °
40°
20°
0 °
20°E
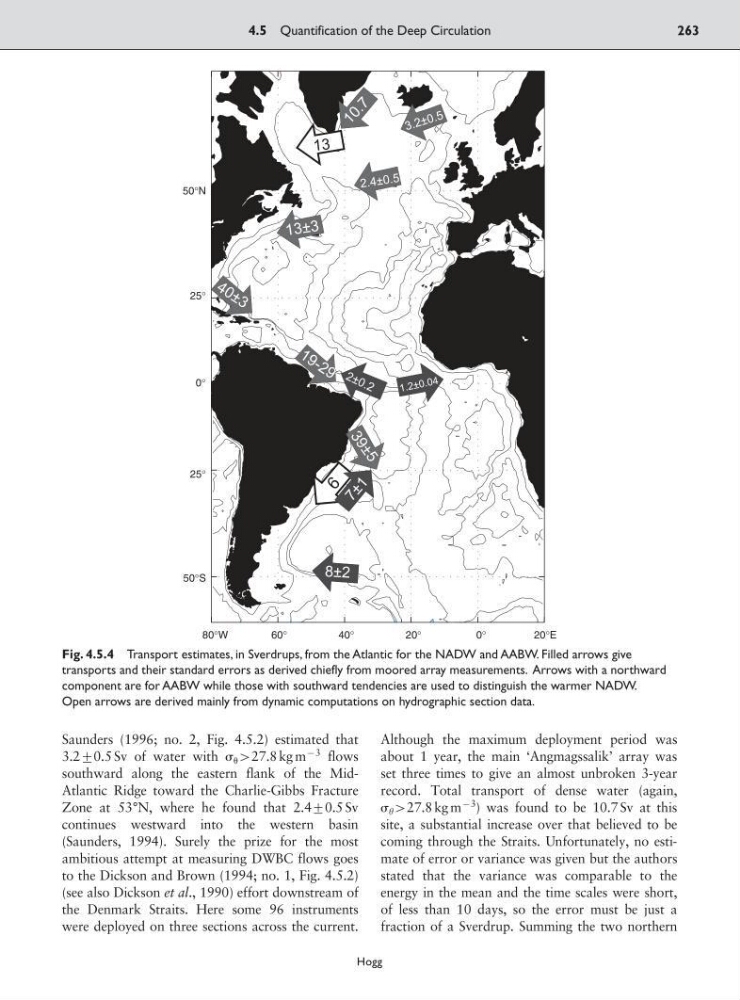
Fig. 4.5.4 Transport estimates, in Sverdrups, from the Atlantic for the NADW and AABW. Filled arrows give
transports and their standard errors as derived chiefly from moored array measurements. Arrows with a northward
component are for AABW while those with southward tendencies are used to distinguish the warmer NADW.
Open arrows are derived mainly from dynamic computations on hydrographic section data.
3.2<0.5 Sv of water with 927.8 kg m
93 flows
southward along the eastern flank of the MidAtlantic Ridge toward the Charlie-Gibbs Fracture
Zone at 53°N, where he found that 2.4<0.5 Sv
continues westward into the western basin
(Saunders, 1994). Surely the prize for the most
ambitious attempt at measuring DWBC flows goes
to the Dickson and Brown (1994; no. 1, Fig. 4.5.2)
(see also Dickson et al., 1990) effort downstream of
the Denmark Straits. Here some 96 instruments
were deployed on three sections across the current.
Although the maximum deployment period was
about 1 year, the main ‘Angmagssalik’ array was
set three times to give an almost unbroken 3-year
record. Total transport of dense water (again,
927.8 kg m
93
) was found to be 10.7 Sv at this
site, a substantial increase over that believed to be
coming through the Straits. Unfortunately, no estimate of error or variance was given but the authors
stated that the variance was comparable to the
energy in the mean and the time scales were short,
of less than 10 days, so the error must be just a
fraction of a Sverdrup. Summing the two northern
4.5 Quantification of the Deep Circulation
263
Hogg
50°N
25°
0°
25°
50°S
80°W
6 0 °
40°
20°
0 °
20°E
Fig. 4.5.4 Transport estimates, in Sverdrups, from the Atlantic for the NADW and AABW. Filled arrows give
transports and their standard errors as derived chiefly from moored array measurements. Arrows with a northward
component are for AABW while those with southward tendencies are used to distinguish the warmer NADW.
Open arrows are derived mainly from dynamic computations on hydrographic section data.