

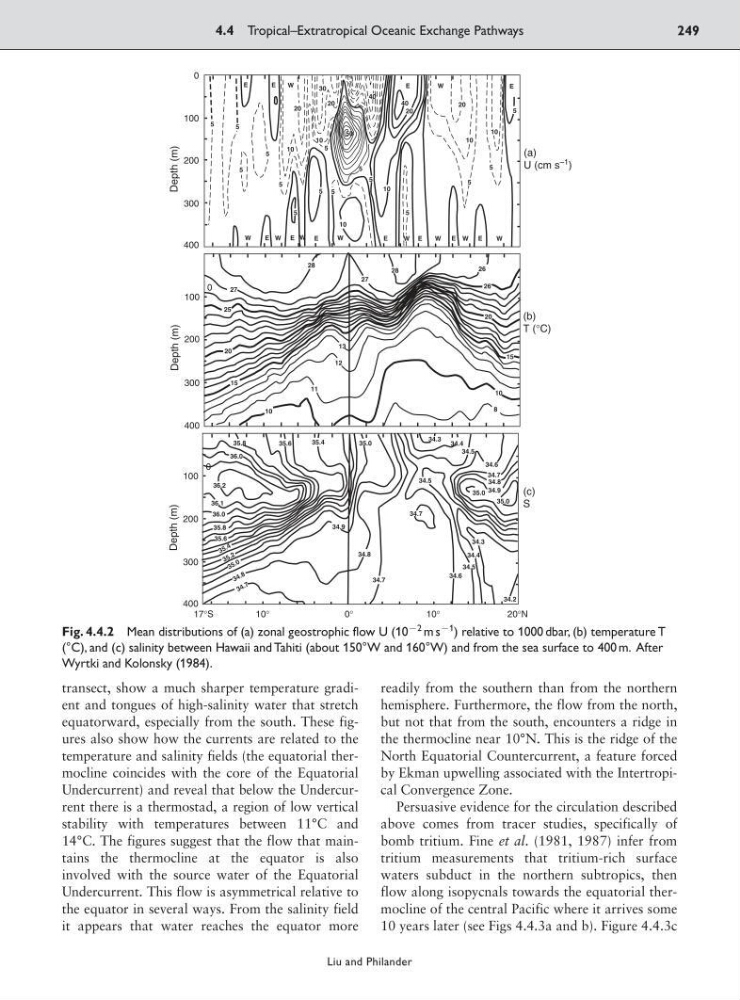
transect, show a much sharper temperature gradient and tongues of high-salinity water that stretch
equatorward, especially from the south. These figures also show how the currents are related to the
temperature and salinity fields (the equatorial thermocline coincides with the core of the Equatorial
Undercurrent) and reveal that below the Undercurrent there is a thermostad, a region of low vertical
stability with temperatures between 11°C and
14°C. The figures suggest that the flow that maintains the thermocline at the equator is also
involved with the source water of the Equatorial
Undercurrent. This flow is asymmetrical relative to
the equator in several ways. From the salinity field
it appears that water reaches the equator more
readily from the southern than from the northern
hemisphere. Furthermore, the flow from the north,
but not that from the south, encounters a ridge in
the thermocline near 10°N. This is the ridge of the
North Equatorial Countercurrent, a feature forced
by Ekman upwelling associated with the Intertropical Convergence Zone.
Persuasive evidence for the circulation described
above comes from tracer studies, specifically of
bomb tritium. Fine et al. (1981, 1987) infer from
tritium measurements that tritium-rich surface
waters subduct in the northern subtropics, then
flow along isopycnals towards the equatorial thermocline of the central Pacific where it arrives some
10 years later (see Figs 4.4.3a and b). Figure 4.4.3c
4.4 Tropical–Extratropical Oceanic Exchange Pathways
249
Liu and Philander
0
100
200
300
400
Depth (m)
0
100
200
300
400
Depth (m)
0
100
200
300
400
Depth (m)
(a)
U (cm s
–1 )
(b)
T (°C)
(c)
S
17°S
1 0 °
10°
0°
20°N
Fig. 4.4.2 Mean distributions of (a) zonal geostrophic flow U (10
92 m s
91 ) relative to 1000 dbar, (b) temperature T
(°C), and (c) salinity between Hawaii and Tahiti (about 150°W and 160°W) and from the sea surface to 400 m. After
Wyrtki and Kolonsky (1984).
equatorward, especially from the south. These figures also show how the currents are related to the
temperature and salinity fields (the equatorial thermocline coincides with the core of the Equatorial
Undercurrent) and reveal that below the Undercurrent there is a thermostad, a region of low vertical
stability with temperatures between 11°C and
14°C. The figures suggest that the flow that maintains the thermocline at the equator is also
involved with the source water of the Equatorial
Undercurrent. This flow is asymmetrical relative to
the equator in several ways. From the salinity field
it appears that water reaches the equator more
readily from the southern than from the northern
hemisphere. Furthermore, the flow from the north,
but not that from the south, encounters a ridge in
the thermocline near 10°N. This is the ridge of the
North Equatorial Countercurrent, a feature forced
by Ekman upwelling associated with the Intertropical Convergence Zone.
Persuasive evidence for the circulation described
above comes from tracer studies, specifically of
bomb tritium. Fine et al. (1981, 1987) infer from
tritium measurements that tritium-rich surface
waters subduct in the northern subtropics, then
flow along isopycnals towards the equatorial thermocline of the central Pacific where it arrives some
10 years later (see Figs 4.4.3a and b). Figure 4.4.3c
4.4 Tropical–Extratropical Oceanic Exchange Pathways
249
Liu and Philander
0
100
200
300
400
Depth (m)
0
100
200
300
400
Depth (m)
0
100
200
300
400
Depth (m)
(a)
U (cm s
–1 )
(b)
T (°C)
(c)
S
17°S
1 0 °
10°
0°
20°N
Fig. 4.4.2 Mean distributions of (a) zonal geostrophic flow U (10
92 m s
91 ) relative to 1000 dbar, (b) temperature T
(°C), and (c) salinity between Hawaii and Tahiti (about 150°W and 160°W) and from the sea surface to 400 m. After
Wyrtki and Kolonsky (1984).