

SECTION 4 THE GLOBAL FLOW FIELD
248
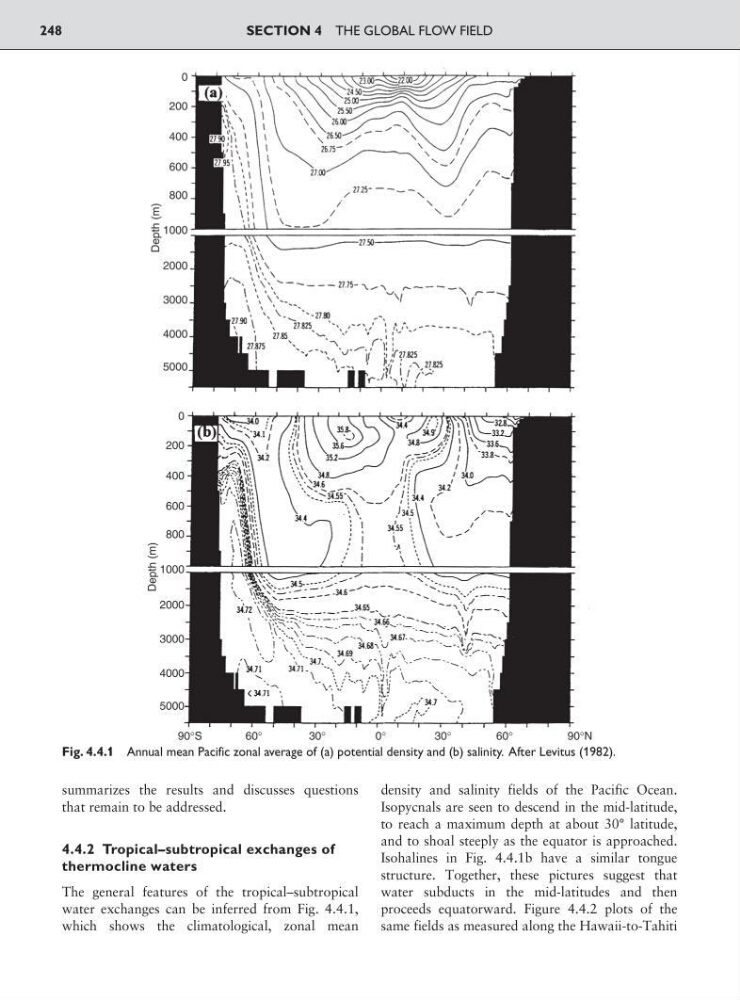
Fig. 4.4.1 Annual mean Pacific zonal average of (a) potential density and (b) salinity. After Levitus (1982).
summarizes the results and discusses questions
that remain to be addressed.
4.4.2 Tropical–subtropical exchanges of
thermocline waters
The general features of the tropical–subtropical
water exchanges can be inferred from Fig. 4.4.1,
which shows the climatological, zonal mean
density and salinity fields of the Pacific Ocean.
Isopycnals are seen to descend in the mid-latitude,
to reach a maximum depth at about 30° latitude,
and to shoal steeply as the equator is approached.
Isohalines in Fig. 4.4.1b have a similar tongue
structure. Together, these pictures suggest that
water subducts in the mid-latitudes and then
proceeds equatorward. Figure 4.4.2 plots of the
same fields as measured along the Hawaii-to-Tahiti
248
Fig. 4.4.1 Annual mean Pacific zonal average of (a) potential density and (b) salinity. After Levitus (1982).
summarizes the results and discusses questions
that remain to be addressed.
4.4.2 Tropical–subtropical exchanges of
thermocline waters
The general features of the tropical–subtropical
water exchanges can be inferred from Fig. 4.4.1,
which shows the climatological, zonal mean
density and salinity fields of the Pacific Ocean.
Isopycnals are seen to descend in the mid-latitude,
to reach a maximum depth at about 30° latitude,
and to shoal steeply as the equator is approached.
Isohalines in Fig. 4.4.1b have a similar tongue
structure. Together, these pictures suggest that
water subducts in the mid-latitudes and then
proceeds equatorward. Figure 4.4.2 plots of the
same fields as measured along the Hawaii-to-Tahiti