

oceanic production rate of 11 Tg N-N 2 O per annum
calculated from new production and nitrification.
Nitric Oxide (NO)
Nitric oxide (NO) plays a central role in atmospheric
chemistry, influencing both ozone cycling and the
tropospheric oxidation capacity through reactions
with hydroperoxy- and organic peroxy-radicals.
When the NO concentration exceeds B40 pptv
(pptv ¼ parts per trillion by volume) it catalyzes the
production of ozone (O 3 ):
CO þ OH
à þ O 2 -HO
Ã
2 þ CO 2
½1
HO
Ã
2 þ NO-OH
à þ NO 2
½2
NO 2 þ hn-NO þ O
3 P
À Á
½3
O þ O 2 þ M-O 3 þ M
½4
At high concentrations (450 ppbv; ppbv ¼ parts
per billion by volume), O 3 in the atmospheric
boundary layer becomes a toxic pollutant that also
has important radiative transfer properties. The
production of nitric acid from NO influences atmospheric pH, and contributes to acid rain formation. In addition, the oxidation of NO to the
nitrate (NO 3 ) radical at night influences the oxidizing capacity of the lower troposphere. Determination of the magnitude and location of NO sources is
critical to modeling boundary layer and free tropospheric chemistry.
NO cycling in the ocean has received limited attention, as a result of its thermodynamic instability
and high reactivity. Photolysis of nitrite in surface
waters occurs via the formation of a nitrite radical
with the production of NO:
NO
À
2 þ hn-NO
ÀÃ
2 þ HOH-NO þ OH
À þ OH
This reaction may account for 10% of nitrite loss in
surface waters of the Central Equatorial Pacific, resulting in a 1000-fold increase in dissolved NO at a
steady-state surface concentration of 5 pmol dm
À3
during light periods (pmol ¼ 1 Â 10
À12 mol). This
photolytic production is balanced by a sink reaction
with the superoxide radical (O 2
À ) to produce peroxynitrite:
O
À
2 þ NOÀ OONO
This reaction will be dependent upon steady-state
concentration of the superoxide radical; however, as
the reaction has a high rate constant, NO is rapidly
turned over with a half-life on the order of 10–100
seconds.
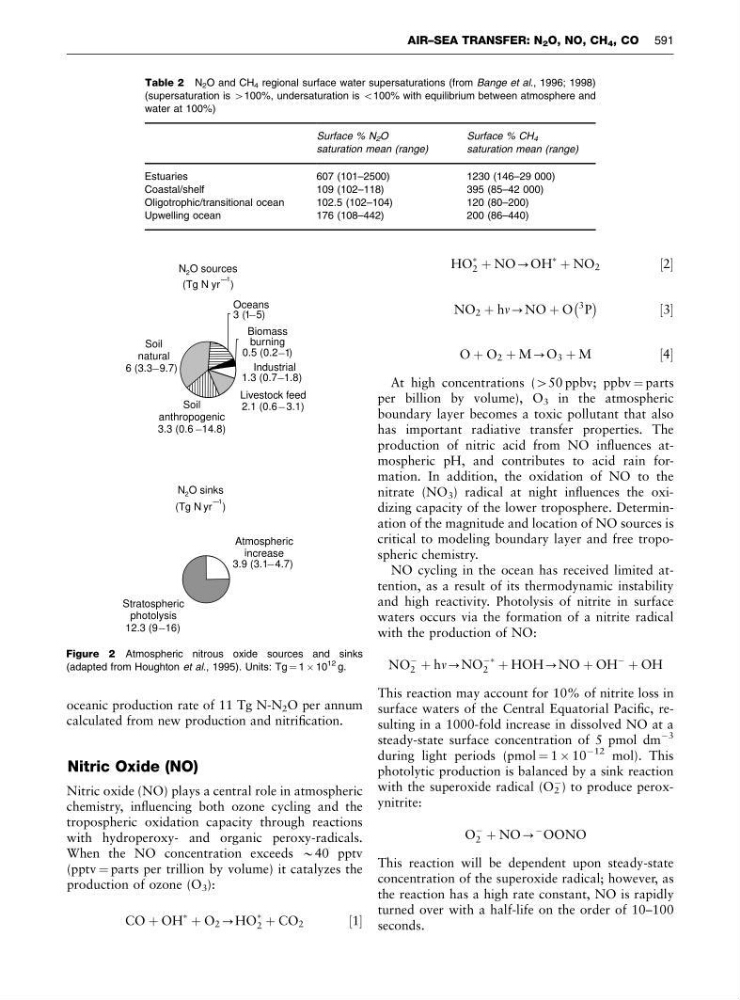
Soil
anthropogenic
3.3 (0.6 _ 14.8)
Atmospheric
increase
3.9 (3.1 _ 4.7)
Stratospheric
photolysis
12.3 (9 _ 16)
Oceans
3 (1 _ 5)
Biomass
burning
0.5 (0.2 _ 1)
Industrial
1.3 (0.7 _ 1.8)
Livestock feed
2.1 (0.6 _ 3.1)
Soil
natural
6 (3.3 _ 9.7)
N O sinks
(Tg N yr
_
)
2
1
N O sources
2
(Tg N yr
_
)
1
Figure 2 Atmospheric nitrous oxide sources and sinks
(adapted from Houghton et al., 1995). Units: Tg ¼ 1 Â 10
12 g.
Table 2 N 2 O and CH 4 regional surface water supersaturations (from Bange et al., 1996; 1998)
(supersaturation is 4100%, undersaturation is o100% with equilibrium between atmosphere and
water at 100%)
Surface % N 2 O
saturation mean (range)
Surface % CH 4
saturation mean (range)
Estuaries
607 (101–2500)
1230 (146–29 000)
Coastal/shelf
109 (102–118)
395 (85–42 000)
Oligotrophic/transitional ocean
102.5 (102–104)
120 (80–200)
Upwelling ocean
176 (108–442)
200 (86–440)
AIR–SEA TRANSFER: N 2 O, NO, CH 4 , CO 591