

compounds, such as nitrate and nitrite, are converted
to volatile reduced compounds (N 2 O and N 2 ) in the
absence of oxygen. Oxygen availability inhibits denitrification at ambient levels, and also determines
the products of denitrification. An enzymatic gradient of sensitivity to oxygen results in the accumulation of N 2 O under sub-oxia (3–10 mmol dm
3
) due
to the inhibition of the enzyme nitrous oxide reductase. At lower oxygen (o3 mmol dm
3
) the reaction
continues through to N 2 and so anoxic environments
are sinks for N 2 O. N 2 O yields from nitrification are
0.2–0.5%, whereas denitrification yields may be as
high as 5% at optimal levels of sub-oxia.
An inverse correlation between N 2 O and oxygen,
and associated linear relationship between nitrate
and N 2 O, suggest that N 2 O in the ocean originates
primarily from nitrification. This may not be the case
for sediments, in which denitrification is the dominant source of N 2 O under variable oxygen tension,
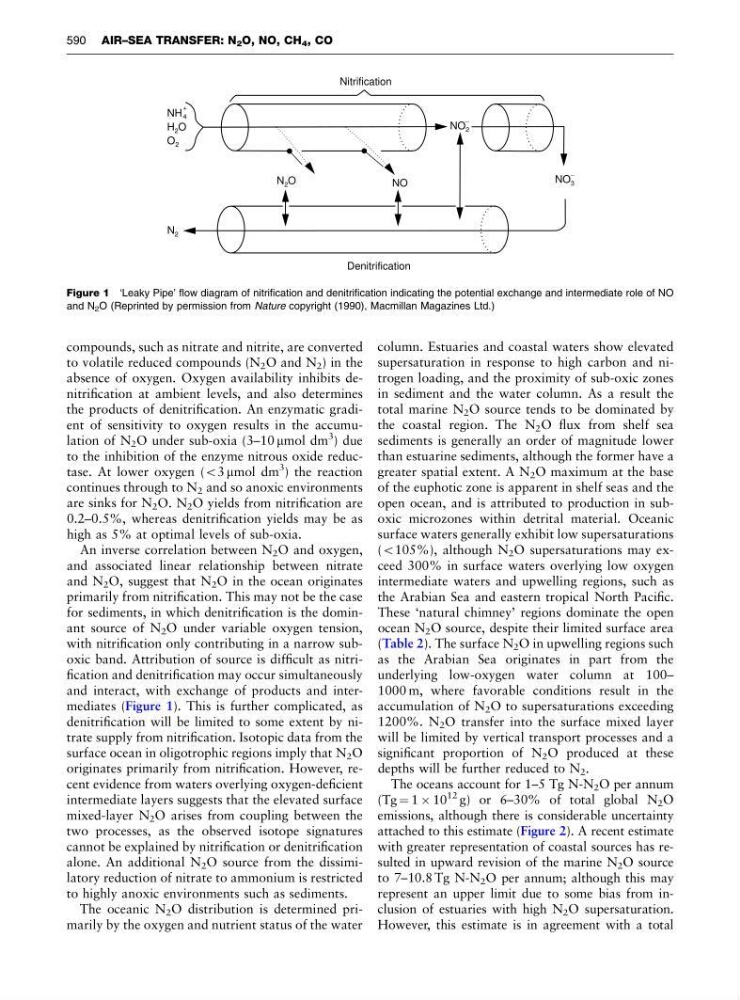
with nitrification only contributing in a narrow suboxic band. Attribution of source is difficult as nitrification and denitrification may occur simultaneously
and interact, with exchange of products and intermediates (Figure 1). This is further complicated, as
denitrification will be limited to some extent by nitrate supply from nitrification. Isotopic data from the
surface ocean in oligotrophic regions imply that N 2 O
originates primarily from nitrification. However, recent evidence from waters overlying oxygen-deficient
intermediate layers suggests that the elevated surface
mixed-layer N 2 O arises from coupling between the
two processes, as the observed isotope signatures
cannot be explained by nitrification or denitrification
alone. An additional N 2 O source from the dissimilatory reduction of nitrate to ammonium is restricted
to highly anoxic environments such as sediments.
The oceanic N 2 O distribution is determined primarily by the oxygen and nutrient status of the water
column. Estuaries and coastal waters show elevated
supersaturation in response to high carbon and nitrogen loading, and the proximity of sub-oxic zones
in sediment and the water column. As a result the
total marine N 2 O source tends to be dominated by
the coastal region. The N 2 O flux from shelf sea
sediments is generally an order of magnitude lower
than estuarine sediments, although the former have a
greater spatial extent. A N 2 O maximum at the base
of the euphotic zone is apparent in shelf seas and the
open ocean, and is attributed to production in suboxic microzones within detrital material. Oceanic
surface waters generally exhibit low supersaturations
(o105%), although N 2 O supersaturations may exceed 300% in surface waters overlying low oxygen
intermediate waters and upwelling regions, such as
the Arabian Sea and eastern tropical North Pacific.
These ‘natural chimney’ regions dominate the open
ocean N 2 O source, despite their limited surface area
(Table 2). The surface N 2 O in upwelling regions such
as the Arabian Sea originates in part from the
underlying low-oxygen water column at 100–
1000 m, where favorable conditions result in the
accumulation of N 2 O to supersaturations exceeding
1200%. N 2 O transfer into the surface mixed layer
will be limited by vertical transport processes and a
significant proportion of N 2 O produced at these
depths will be further reduced to N 2 .
The oceans account for 1–5 Tg N-N 2 O per annum
(Tg ¼ 1 Â 10
12 g) or 6–30% of total global N 2 O
emissions, although there is considerable uncertainty
attached to this estimate (Figure 2). A recent estimate
with greater representation of coastal sources has resulted in upward revision of the marine N 2 O source
to 7–10.8 Tg N-N 2 O per annum; although this may
represent an upper limit due to some bias from inclusion of estuaries with high N 2 O supersaturation.
However, this estimate is in agreement with a total
NO 3
_
Nitrification
Denitrification
N 2
NO
N O
2
NH
H O
O
+
4
2
2
NO 2
_
Figure 1 ‘Leaky Pipe’ flow diagram of nitrification and denitrification indicating the potential exchange and intermediate role of NO
and N 2 O (Reprinted by permission from Nature copyright (1990), Macmillan Magazines Ltd.)
590 AIR–SEA TRANSFER: N 2 O, NO, CH 4 , CO