

AIR–SEA TRANSFER: N 2 O, NO, CH 4 , CO
C. S. Law, Plymouth Marine Laboratory, The Hoe,
Plymouth, UK
Copyright & 2001 Elsevier Ltd.
Introduction
The atmospheric composition is maintained by abiotic
and biotic processes in the terrestrial and marine
ecosystems. The biogenic trace gases nitrous oxide
(N 2 O), nitric oxide (NO), methane (CH 4 ) and carbon
monoxide (CO) are present in the surface mixed layer over most of the ocean, at concentrations
which exceed those expected from equilibration with
the atmosphere. As the oceans occupy 70% of the
global surface area, exchange of these trace gases
across the air–sea interface represents a source/sink for
global atmospheric budgets and oceanic biogeochemical budgets, although marine emissions of NO
are poorly characterized. These trace gases contribute
to global change directly and indirectly, by influencing
the atmospheric oxidation and radiative capacity
(the ‘greenhouse effect’) and, together with their reaction products, impact stratospheric ozone chemistry
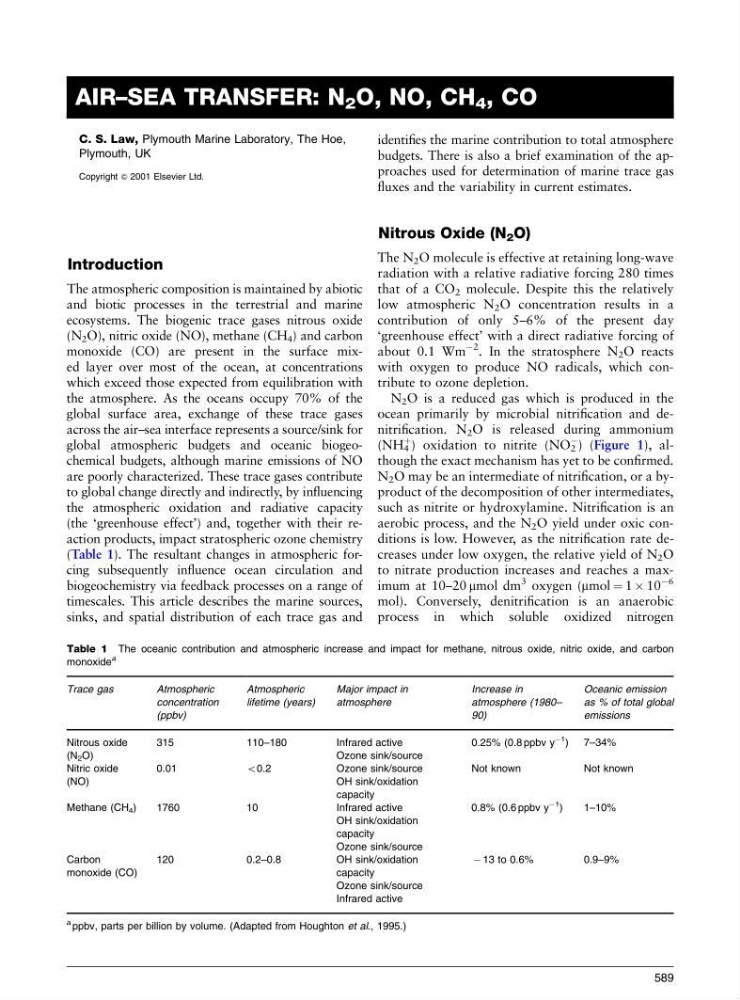
(Table 1). The resultant changes in atmospheric forcing subsequently influence ocean circulation and
biogeochemistry via feedback processes on a range of
timescales. This article describes the marine sources,
sinks, and spatial distribution of each trace gas and
identifies the marine contribution to total atmosphere
budgets. There is also a brief examination of the approaches used for determination of marine trace gas
fluxes and the variability in current estimates.
Nitrous Oxide (N 2 O)
The N 2 O molecule is effective at retaining long-wave
radiation with a relative radiative forcing 280 times
that of a CO 2 molecule. Despite this the relatively
low atmospheric N 2 O concentration results in a
contribution of only 5–6% of the present day
‘greenhouse effect’ with a direct radiative forcing of
about 0.1 Wm
À2
. In the stratosphere N 2 O reacts
with oxygen to produce NO radicals, which contribute to ozone depletion.
N 2 O is a reduced gas which is produced in the
ocean primarily by microbial nitrification and denitrification. N 2 O is released during ammonium
(NH 4
þ ) oxidation to nitrite (NO 2
À
) (Figure 1), although the exact mechanism has yet to be confirmed.
N 2 O may be an intermediate of nitrification, or a byproduct of the decomposition of other intermediates,
such as nitrite or hydroxylamine. Nitrification is an
aerobic process, and the N 2 O yield under oxic conditions is low. However, as the nitrification rate decreases under low oxygen, the relative yield of N 2 O
to nitrate production increases and reaches a maximum at 10–20 mmol dm
3 oxygen (mmol ¼ 1 Â 10
À6
mol). Conversely, denitrification is an anaerobic
process in which soluble oxidized nitrogen
Table 1 The oceanic contribution and atmospheric increase and impact for methane, nitrous oxide, nitric oxide, and carbon
monoxide
a
Trace gas
Atmospheric
concentration
(ppbv)
Atmospheric
lifetime (years)
Major impact in
atmosphere
Increase in
atmosphere (1980–
90)
Oceanic emission
as % of total global
emissions
Nitrous oxide
(N 2 O)
315
110–180
Infrared active
Ozone sink/source
0.25% (0.8 ppbv y
À1 ) 7–34%
Nitric oxide
(NO)
0.01
o0.2
Ozone sink/source
OH sink/oxidation
capacity
Not known
Not known
Methane (CH 4 )
1760
10
Infrared active
OH sink/oxidation
capacity
Ozone sink/source
0.8% (0.6 ppbv y
À1
)
1–10%
Carbon
monoxide (CO)
120
0.2–0.8
OH sink/oxidation
capacity
Ozone sink/source
Infrared active
À 13 to 0.6%
0.9–9%
a ppbv, parts per billion by volume. (Adapted from Houghton et al., 1995.)
589