

the different oceanic province have different NPDWnormalized REE patterns due to the input of REEs
from local terrigneous sources (Figure 9). The Nd
isotopic composition (Figure 10) that can serve as a
‘fingerprint’ of REE source also varies significantly
with location. The geographical distributions of Nd
concentration and its isotopic composition, and the
NPDW-normalized REE pattern are hardly explained by the pattern of prevailing winds. All suggest that the REEs are supplied to the ocean from
local sources and their mean residence times in the
surface waters are relatively short as compared to
homogenization by lateral mixing. The surface Nd
distribution somewhat resembles that of fluvially and
coastally derived
228
Ra with a half-life of 5.7 years
which is predominantly supplied to the coastal and
shelf waters from underlying sediments.
Since the direct riverine flux of dissolved Nd is not
sufficient to yield its short mean residence time required for the oceanic Nd isotopic heterogeneity,
some additional mechanism must be sought for the
coastal and shelf sources of the REEs. Remineralization of REEs from river-transported sediments
may occur near the coast and on the shelf. For instance, if only 1–2% of detrital Nd is released to the
coastal water, then the mean oceanic residence time
of Nd is shortened to as less than 1000 years. In
reality, there is some evidence that the REEs are released from sediments to the overlying water in the
outer high-salinity regions of the Amazon and Fly
River estuaries. Fractionation can also take place in
the sediment diagenesis, and hence, makes the REE
patterns of the surface waters different from those of
river waters, depending upon the oceanic province.
The highly radiogenic e Nd values observed near the
Indonesian Archipelago (Figure 10) also suggest that
erosion of volcanic islands can be an important
source of REEs to the ocean. Although quantification
of these local sources of REEs is difficult at present,
the coastal and shelf mechanism appears to be significant in the balance of dissolved REEs in the ocean
(Table 3).
(A)
(B)
No anomaly
La
Ce
Nd
2500
2000
1500
1000
500
0
Depth (m)
2500
2000
1500
1000
500
0
Depth (m)
250
200
150
100
50
0
250
200
150
100
50
0
0
50
100
150
200
REE concentration (pmol kg
_ 1
)
0.0
0.2
0.4
0.6
0.8
1.0
1.2
Ce/Ce*
Sulfide interface
Sulfide interface
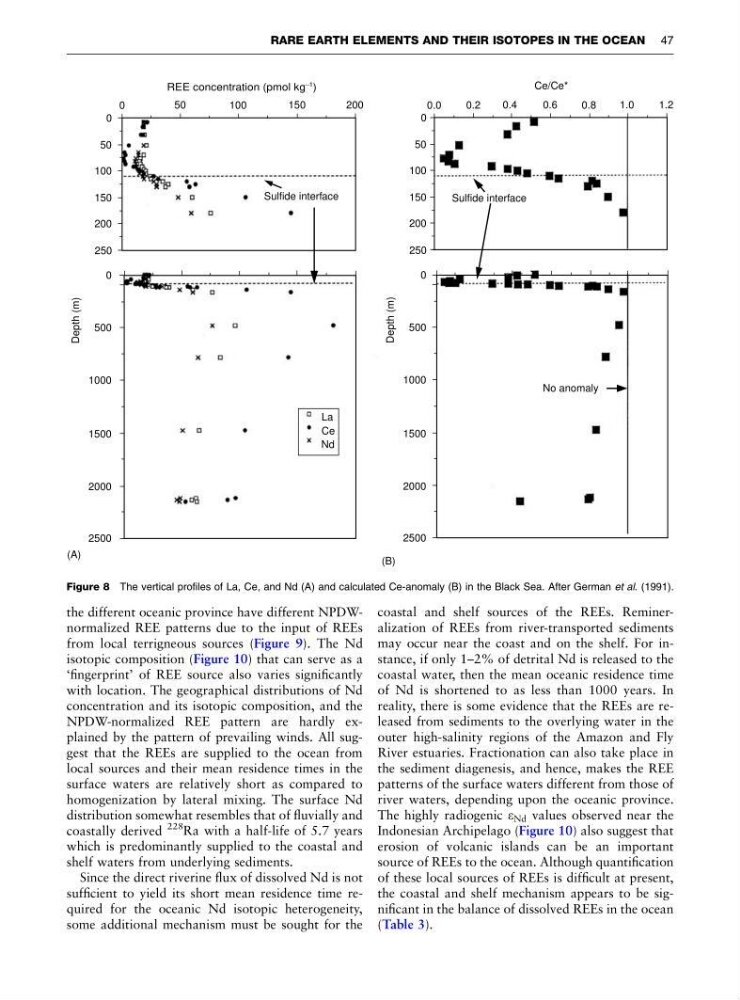
Figure 8 The vertical profiles of La, Ce, and Nd (A) and calculated Ce-anomaly (B) in the Black Sea. After German et al. (1991).
RARE EARTH ELEMENTS AND THEIR ISOTOPES IN THE OCEAN 47
from local terrigneous sources (Figure 9). The Nd
isotopic composition (Figure 10) that can serve as a
‘fingerprint’ of REE source also varies significantly
with location. The geographical distributions of Nd
concentration and its isotopic composition, and the
NPDW-normalized REE pattern are hardly explained by the pattern of prevailing winds. All suggest that the REEs are supplied to the ocean from
local sources and their mean residence times in the
surface waters are relatively short as compared to
homogenization by lateral mixing. The surface Nd
distribution somewhat resembles that of fluvially and
coastally derived
228
Ra with a half-life of 5.7 years
which is predominantly supplied to the coastal and
shelf waters from underlying sediments.
Since the direct riverine flux of dissolved Nd is not
sufficient to yield its short mean residence time required for the oceanic Nd isotopic heterogeneity,
some additional mechanism must be sought for the
coastal and shelf sources of the REEs. Remineralization of REEs from river-transported sediments
may occur near the coast and on the shelf. For instance, if only 1–2% of detrital Nd is released to the
coastal water, then the mean oceanic residence time
of Nd is shortened to as less than 1000 years. In
reality, there is some evidence that the REEs are released from sediments to the overlying water in the
outer high-salinity regions of the Amazon and Fly
River estuaries. Fractionation can also take place in
the sediment diagenesis, and hence, makes the REE
patterns of the surface waters different from those of
river waters, depending upon the oceanic province.
The highly radiogenic e Nd values observed near the
Indonesian Archipelago (Figure 10) also suggest that
erosion of volcanic islands can be an important
source of REEs to the ocean. Although quantification
of these local sources of REEs is difficult at present,
the coastal and shelf mechanism appears to be significant in the balance of dissolved REEs in the ocean
(Table 3).
(A)
(B)
No anomaly
La
Ce
Nd
2500
2000
1500
1000
500
0
Depth (m)
2500
2000
1500
1000
500
0
Depth (m)
250
200
150
100
50
0
250
200
150
100
50
0
0
50
100
150
200
REE concentration (pmol kg
_ 1
)
0.0
0.2
0.4
0.6
0.8
1.0
1.2
Ce/Ce*
Sulfide interface
Sulfide interface
Figure 8 The vertical profiles of La, Ce, and Nd (A) and calculated Ce-anomaly (B) in the Black Sea. After German et al. (1991).
RARE EARTH ELEMENTS AND THEIR ISOTOPES IN THE OCEAN 47