

The d
15
N of nitrite is expected to reflect the balance of isotopic fractionation during nitrite production and consumption processes. In the eastern
tropical North Pacific, the d
15 N of nitrite is very low
( À 18% to À 7%). This d
15 N is B30% lower than
the nitrate in the same environment and is lower than
expected from denitrification alone, give the known
isotope effects for nitrate and nitrite reduction. The
4
4.5
5
5.5
6
6.5
7
7.5
4000
3500
3000
2500
2000
1500
1000
500
0
20
(a)
(b)
25
30
35
40
Depth (m)
[NO 3
− ] (μmol kg
−1 )
15 N (‰ vs. air)
(c)
[NO 3
− ]
15 NO 3
−
0
5
10
15
20
25
30
35
4
5
+
+
+
+
+
+
+
+
+
+
+ +
+
+
+
+
+
+
+
6
7
8
9
10
11
12
13
14
40
42
44
46
48
50
52
54
56
58
60
[NO
3
−
] (μM)
Latitude along 115° E (S)
15 N (‰ vs. air)
Sediment
15 N
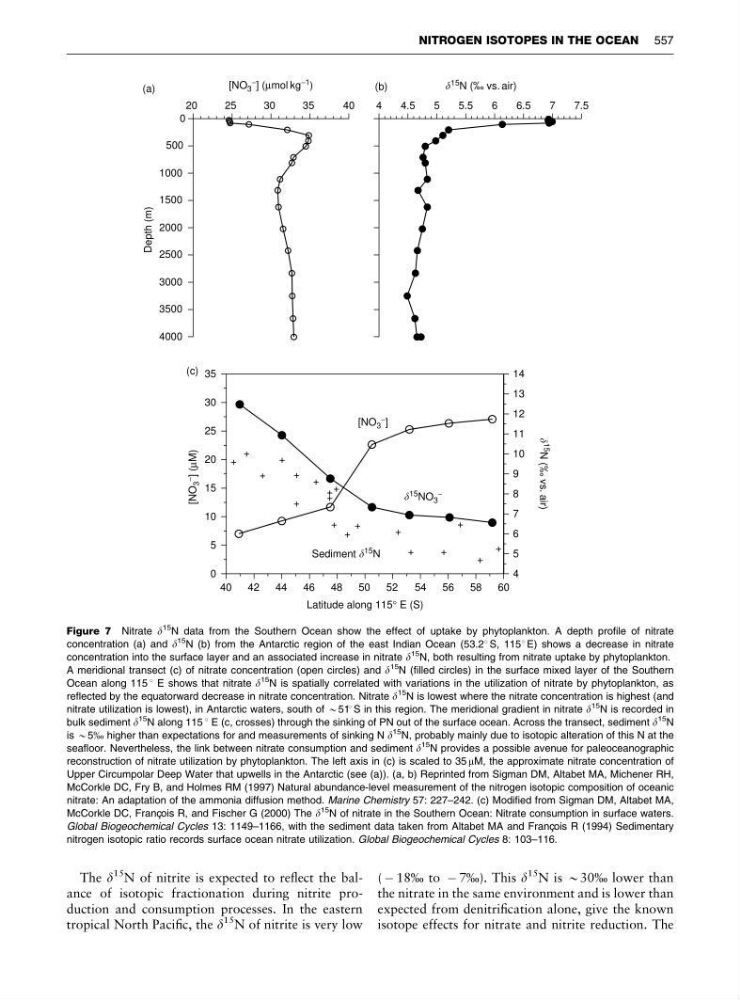
Figure 7 Nitrate d
15 N data from the Southern Ocean show the effect of uptake by phytoplankton. A depth profile of nitrate
concentration (a) and d
15 N (b) from the Antarctic region of the east Indian Ocean (53.21 S, 1151 E) shows a decrease in nitrate
concentration into the surface layer and an associated increase in nitrate d
15 N, both resulting from nitrate uptake by phytoplankton.
A meridional transect (c) of nitrate concentration (open circles) and d
15
N (filled circles) in the surface mixed layer of the Southern
Ocean along 115 1 E shows that nitrate d
15
N is spatially correlated with variations in the utilization of nitrate by phytoplankton, as
reflected by the equatorward decrease in nitrate concentration. Nitrate d
15 N is lowest where the nitrate concentration is highest (and
nitrate utilization is lowest), in Antarctic waters, south of B511 S in this region. The meridional gradient in nitrate d
15 N is recorded in
bulk sediment d
15 N along 115 1 E (c, crosses) through the sinking of PN out of the surface ocean. Across the transect, sediment d
15 N
is B5% higher than expectations for and measurements of sinking N d
15 N, probably mainly due to isotopic alteration of this N at the
seafloor. Nevertheless, the link between nitrate consumption and sediment d
15 N provides a possible avenue for paleoceanographic
reconstruction of nitrate utilization by phytoplankton. The left axis in (c) is scaled to 35 mM, the approximate nitrate concentration of
Upper Circumpolar Deep Water that upwells in the Antarctic (see (a)). (a, b) Reprinted from Sigman DM, Altabet MA, Michener RH,
McCorkle DC, Fry B, and Holmes RM (1997) Natural abundance-level measurement of the nitrogen isotopic composition of oceanic
nitrate: An adaptation of the ammonia diffusion method. Marine Chemistry 57: 227–242. (c) Modified from Sigman DM, Altabet MA,
McCorkle DC, Franc¸ ois R, and Fischer G (2000) The d
15 N of nitrate in the Southern Ocean: Nitrate consumption in surface waters.
Global Biogeochemical Cycles 13: 1149–1166, with the sediment data taken from Altabet MA and Franc¸ ois R (1994) Sedimentary
nitrogen isotopic ratio records surface ocean nitrate utilization. Global Biogeochemical Cycles 8: 103–116.
NITROGEN ISOTOPES IN THE OCEAN 557
15
N of nitrite is expected to reflect the balance of isotopic fractionation during nitrite production and consumption processes. In the eastern
tropical North Pacific, the d
15 N of nitrite is very low
( À 18% to À 7%). This d
15 N is B30% lower than
the nitrate in the same environment and is lower than
expected from denitrification alone, give the known
isotope effects for nitrate and nitrite reduction. The
4
4.5
5
5.5
6
6.5
7
7.5
4000
3500
3000
2500
2000
1500
1000
500
0
20
(a)
(b)
25
30
35
40
Depth (m)
[NO 3
− ] (μmol kg
−1 )
15 N (‰ vs. air)
(c)
[NO 3
− ]
15 NO 3
−
0
5
10
15
20
25
30
35
4
5
+
+
+
+
+
+
+
+
+
+
+ +
+
+
+
+
+
+
+
6
7
8
9
10
11
12
13
14
40
42
44
46
48
50
52
54
56
58
60
[NO
3
−
] (μM)
Latitude along 115° E (S)
15 N (‰ vs. air)
Sediment
15 N
Figure 7 Nitrate d
15 N data from the Southern Ocean show the effect of uptake by phytoplankton. A depth profile of nitrate
concentration (a) and d
15 N (b) from the Antarctic region of the east Indian Ocean (53.21 S, 1151 E) shows a decrease in nitrate
concentration into the surface layer and an associated increase in nitrate d
15 N, both resulting from nitrate uptake by phytoplankton.
A meridional transect (c) of nitrate concentration (open circles) and d
15
N (filled circles) in the surface mixed layer of the Southern
Ocean along 115 1 E shows that nitrate d
15
N is spatially correlated with variations in the utilization of nitrate by phytoplankton, as
reflected by the equatorward decrease in nitrate concentration. Nitrate d
15 N is lowest where the nitrate concentration is highest (and
nitrate utilization is lowest), in Antarctic waters, south of B511 S in this region. The meridional gradient in nitrate d
15 N is recorded in
bulk sediment d
15 N along 115 1 E (c, crosses) through the sinking of PN out of the surface ocean. Across the transect, sediment d
15 N
is B5% higher than expectations for and measurements of sinking N d
15 N, probably mainly due to isotopic alteration of this N at the
seafloor. Nevertheless, the link between nitrate consumption and sediment d
15 N provides a possible avenue for paleoceanographic
reconstruction of nitrate utilization by phytoplankton. The left axis in (c) is scaled to 35 mM, the approximate nitrate concentration of
Upper Circumpolar Deep Water that upwells in the Antarctic (see (a)). (a, b) Reprinted from Sigman DM, Altabet MA, Michener RH,
McCorkle DC, Fry B, and Holmes RM (1997) Natural abundance-level measurement of the nitrogen isotopic composition of oceanic
nitrate: An adaptation of the ammonia diffusion method. Marine Chemistry 57: 227–242. (c) Modified from Sigman DM, Altabet MA,
McCorkle DC, Franc¸ ois R, and Fischer G (2000) The d
15 N of nitrate in the Southern Ocean: Nitrate consumption in surface waters.
Global Biogeochemical Cycles 13: 1149–1166, with the sediment data taken from Altabet MA and Franc¸ ois R (1994) Sedimentary
nitrogen isotopic ratio records surface ocean nitrate utilization. Global Biogeochemical Cycles 8: 103–116.
NITROGEN ISOTOPES IN THE OCEAN 557