

meaning of this low d
15 N is still not well understood
but likely points to other processes acting on the
NO 2
À pool. In these regions, nitrite can represent a
significant reservoir of N that is depleted in
15 N.
0.2
0.4
0.6
0.8
6.0 9.0 12.0 15.0
15 N of NO 3
−
15 N of N 2
0
500
1000
1500
2000
Depth (m)
0
500
1000
1500
2000
Depth (m)
Nitrate deficit (μM)
Nitrate (μM)
0
1 0
0 10 20 30 40
(b)
(a)
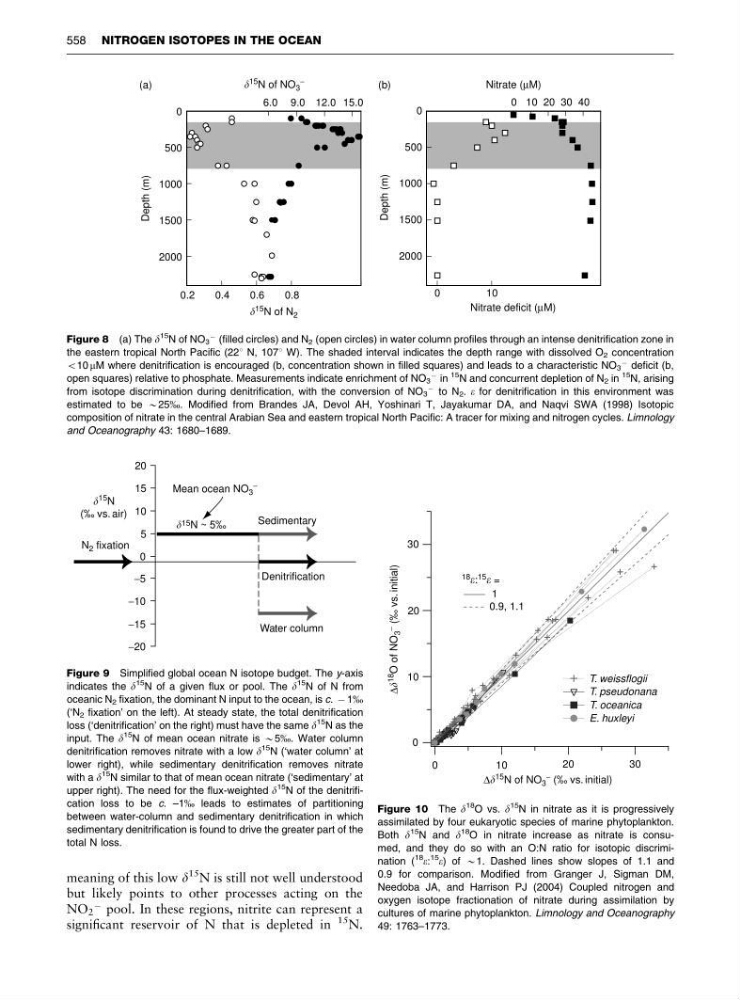
Figure 8 (a) The d
15 N of NO 3
À (filled circles) and N 2 (open circles) in water column profiles through an intense denitrification zone in
the eastern tropical North Pacific (221 N, 1071 W). The shaded interval indicates the depth range with dissolved O 2 concentration
o10 mM where denitrification is encouraged (b, concentration shown in filled squares) and leads to a characteristic NO 3
À deficit (b,
open squares) relative to phosphate. Measurements indicate enrichment of NO 3
À in
15 N and concurrent depletion of N 2 in
15
N, arising
from isotope discrimination during denitrification, with the conversion of NO 3
À to N 2 . e for denitrification in this environment was
estimated to be B25%. Modified from Brandes JA, Devol AH, Yoshinari T, Jayakumar DA, and Naqvi SWA (1998) Isotopic
composition of nitrate in the central Arabian Sea and eastern tropical North Pacific: A tracer for mixing and nitrogen cycles. Limnology
and Oceanography 43: 1680–1689.
20
15
10
5
N 2 fixation
0
−5
−10
−15
−20
Mean ocean NO 3
−
Sedimentary
Denitrification
15 N
(‰ vs. air)
15 N ~ 5‰
Water column
Figure 9 Simplified global ocean N isotope budget. The y-axis
indicates the d
15 N of a given flux or pool. The d
15 N of N from
oceanic N 2 fixation, the dominant N input to the ocean, is c. À 1%
(‘N 2 fixation’ on the left). At steady state, the total denitrification
loss (‘denitrification’ on the right) must have the same d
15 N as the
input. The d
15
N of mean ocean nitrate is B5%. Water column
denitrification removes nitrate with a low d
15 N (‘water column’ at
lower right), while sedimentary denitrification removes nitrate
with a d
15
N similar to that of mean ocean nitrate (‘sedimentary’ at
upper right). The need for the flux-weighted d
15 N of the denitrification loss to be c. –1% leads to estimates of partitioning
between water-column and sedimentary denitrification in which
sedimentary denitrification is found to drive the greater part of the
total N loss.
T. weissflogii
1
18
:
15
=
0.9, 1.1
T. pseudonana
T. oceanica
E. huxleyi
0
0
10
20
30
10
20
30
Δ
18
O of NO
3
−
(‰ vs. initial)
Δ
15 N of NO 3
− (‰ vs. initial)
Figure 10 The d
18
O vs. d
15
N in nitrate as it is progressively
assimilated by four eukaryotic species of marine phytoplankton.
Both d
15 N and d
18
O in nitrate increase as nitrate is consumed, and they do so with an O:N ratio for isotopic discrimination (
18 e:
15 e) of B1. Dashed lines show slopes of 1.1 and
0.9 for comparison. Modified from Granger J, Sigman DM,
Needoba JA, and Harrison PJ (2004) Coupled nitrogen and
oxygen isotope fractionation of nitrate during assimilation by
cultures of marine phytoplankton. Limnology and Oceanography
49: 1763–1773.
558 NITROGEN ISOTOPES IN THE OCEAN
15 N is still not well understood
but likely points to other processes acting on the
NO 2
À pool. In these regions, nitrite can represent a
significant reservoir of N that is depleted in
15 N.
0.2
0.4
0.6
0.8
6.0 9.0 12.0 15.0
15 N of NO 3
−
15 N of N 2
0
500
1000
1500
2000
Depth (m)
0
500
1000
1500
2000
Depth (m)
Nitrate deficit (μM)
Nitrate (μM)
0
1 0
0 10 20 30 40
(b)
(a)
Figure 8 (a) The d
15 N of NO 3
À (filled circles) and N 2 (open circles) in water column profiles through an intense denitrification zone in
the eastern tropical North Pacific (221 N, 1071 W). The shaded interval indicates the depth range with dissolved O 2 concentration
o10 mM where denitrification is encouraged (b, concentration shown in filled squares) and leads to a characteristic NO 3
À deficit (b,
open squares) relative to phosphate. Measurements indicate enrichment of NO 3
À in
15 N and concurrent depletion of N 2 in
15
N, arising
from isotope discrimination during denitrification, with the conversion of NO 3
À to N 2 . e for denitrification in this environment was
estimated to be B25%. Modified from Brandes JA, Devol AH, Yoshinari T, Jayakumar DA, and Naqvi SWA (1998) Isotopic
composition of nitrate in the central Arabian Sea and eastern tropical North Pacific: A tracer for mixing and nitrogen cycles. Limnology
and Oceanography 43: 1680–1689.
20
15
10
5
N 2 fixation
0
−5
−10
−15
−20
Mean ocean NO 3
−
Sedimentary
Denitrification
15 N
(‰ vs. air)
15 N ~ 5‰
Water column
Figure 9 Simplified global ocean N isotope budget. The y-axis
indicates the d
15 N of a given flux or pool. The d
15 N of N from
oceanic N 2 fixation, the dominant N input to the ocean, is c. À 1%
(‘N 2 fixation’ on the left). At steady state, the total denitrification
loss (‘denitrification’ on the right) must have the same d
15 N as the
input. The d
15
N of mean ocean nitrate is B5%. Water column
denitrification removes nitrate with a low d
15 N (‘water column’ at
lower right), while sedimentary denitrification removes nitrate
with a d
15
N similar to that of mean ocean nitrate (‘sedimentary’ at
upper right). The need for the flux-weighted d
15 N of the denitrification loss to be c. –1% leads to estimates of partitioning
between water-column and sedimentary denitrification in which
sedimentary denitrification is found to drive the greater part of the
total N loss.
T. weissflogii
1
18
:
15
=
0.9, 1.1
T. pseudonana
T. oceanica
E. huxleyi
0
0
10
20
30
10
20
30
Δ
18
O of NO
3
−
(‰ vs. initial)
Δ
15 N of NO 3
− (‰ vs. initial)
Figure 10 The d
18
O vs. d
15
N in nitrate as it is progressively
assimilated by four eukaryotic species of marine phytoplankton.
Both d
15 N and d
18
O in nitrate increase as nitrate is consumed, and they do so with an O:N ratio for isotopic discrimination (
18 e:
15 e) of B1. Dashed lines show slopes of 1.1 and
0.9 for comparison. Modified from Granger J, Sigman DM,
Needoba JA, and Harrison PJ (2004) Coupled nitrogen and
oxygen isotope fractionation of nitrate during assimilation by
cultures of marine phytoplankton. Limnology and Oceanography
49: 1763–1773.
558 NITROGEN ISOTOPES IN THE OCEAN