

Concentrations of N 2 O in oceanic surface waters are
generally in slight excess of air saturation, implying
both a local source and a sustained ocean-to-atmosphere flux. Typically there is a mid-water (500–
1000 m) peak in N 2 O concentration that coincides
with the dissolved oxygen minimum. At these intermediate water depths, N 2 O can exceed 300% saturation relative to atmospheric equilibrium. The two
most probable sources of N 2 O in the ocean are bacterial nitrification and bacterial denitrification, although to date it has been difficult to quantify the
relative contribution of each pathway for a given
habitat. Isotopic measurements of nitrogen and oxygen could prove invaluable in this regard. Because the
various nitrogen cycle reactions are interconnected,
changes in the rate of any one process will likely have
an impact on the others. For example, selection for
N 2 -fixing organisms as a consequence of dust deposition or deliberate iron fertilization would increase
the local NH 4
þ inventory and lead to accelerated rates
of nitrification and, hence, enhanced N 2 O production
in the surface ocean and flux to the atmosphere.
Primary Nitrite Maximum
An interesting, almost cosmopolitan feature of the
world ocean is the existence of a primary NO 2
À
0
0.5
1.0
1.5
200
180
160
140
120
100
80
60
40
20
0
4.5
5.0
5.5
6.0 0
0.1 0.2 0.3 0.4
Depth (m)
Nitrate ( mol l )
μ
_ 1
DON ( mol l )
μ
_ 1
PON ( mol l )
μ
_ 1
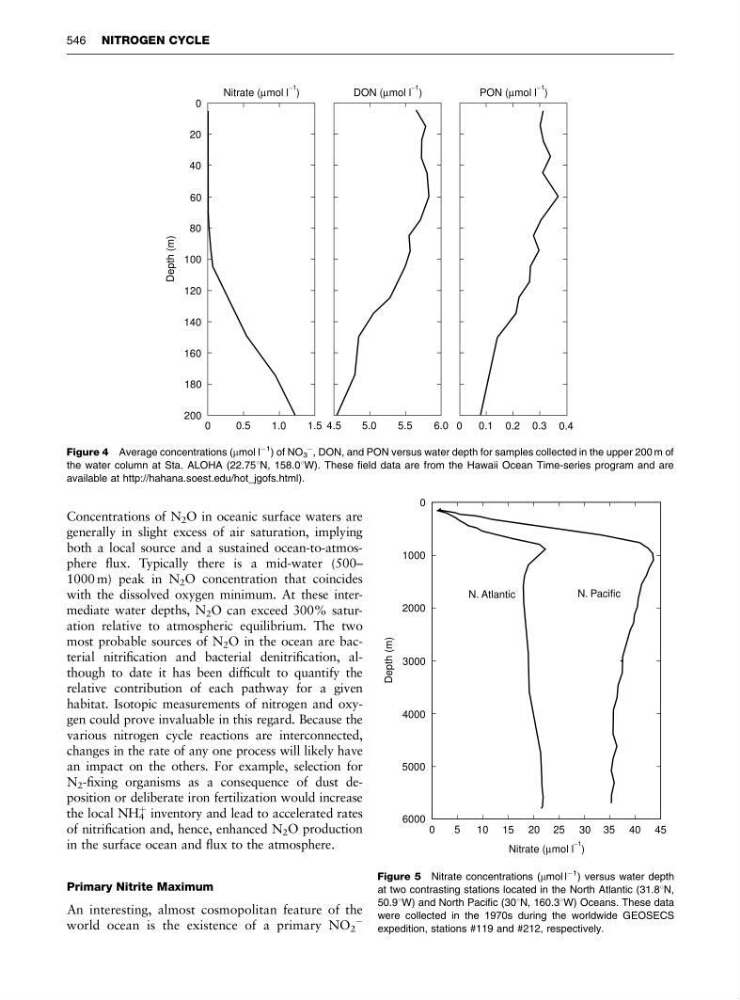
Figure 4 Average concentrations (mmol l
À1 ) of NO 3
À , DON, and PON versus water depth for samples collected in the upper 200 m of
the water column at Sta. ALOHA (22.751N, 158.01W). These field data are from the Hawaii Ocean Time-series program and are
available at http://hahana.soest.edu/hot_jgofs.html).
0
5
10 15 20 25 30 35 40 45
6000
5000
4000
3000
2000
1000
0
Nitrate ( mol l )
μ
_ 1
Depth (m)
N. Atlantic
N. Pacific
Figure 5 Nitrate concentrations (mmol l
À1 ) versus water depth
at two contrasting stations located in the North Atlantic (31.81N,
50.91W) and North Pacific (301N, 160.31W) Oceans. These data
were collected in the 1970s during the worldwide GEOSECS
expedition, stations #119 and #212, respectively.
546 NITROGEN CYCLE
generally in slight excess of air saturation, implying
both a local source and a sustained ocean-to-atmosphere flux. Typically there is a mid-water (500–
1000 m) peak in N 2 O concentration that coincides
with the dissolved oxygen minimum. At these intermediate water depths, N 2 O can exceed 300% saturation relative to atmospheric equilibrium. The two
most probable sources of N 2 O in the ocean are bacterial nitrification and bacterial denitrification, although to date it has been difficult to quantify the
relative contribution of each pathway for a given
habitat. Isotopic measurements of nitrogen and oxygen could prove invaluable in this regard. Because the
various nitrogen cycle reactions are interconnected,
changes in the rate of any one process will likely have
an impact on the others. For example, selection for
N 2 -fixing organisms as a consequence of dust deposition or deliberate iron fertilization would increase
the local NH 4
þ inventory and lead to accelerated rates
of nitrification and, hence, enhanced N 2 O production
in the surface ocean and flux to the atmosphere.
Primary Nitrite Maximum
An interesting, almost cosmopolitan feature of the
world ocean is the existence of a primary NO 2
À
0
0.5
1.0
1.5
200
180
160
140
120
100
80
60
40
20
0
4.5
5.0
5.5
6.0 0
0.1 0.2 0.3 0.4
Depth (m)
Nitrate ( mol l )
μ
_ 1
DON ( mol l )
μ
_ 1
PON ( mol l )
μ
_ 1
Figure 4 Average concentrations (mmol l
À1 ) of NO 3
À , DON, and PON versus water depth for samples collected in the upper 200 m of
the water column at Sta. ALOHA (22.751N, 158.01W). These field data are from the Hawaii Ocean Time-series program and are
available at http://hahana.soest.edu/hot_jgofs.html).
0
5
10 15 20 25 30 35 40 45
6000
5000
4000
3000
2000
1000
0
Nitrate ( mol l )
μ
_ 1
Depth (m)
N. Atlantic
N. Pacific
Figure 5 Nitrate concentrations (mmol l
À1 ) versus water depth
at two contrasting stations located in the North Atlantic (31.81N,
50.91W) and North Pacific (301N, 160.31W) Oceans. These data
were collected in the 1970s during the worldwide GEOSECS
expedition, stations #119 and #212, respectively.
546 NITROGEN CYCLE