

maximum of about 40–45 it mmol l
À1 at about
1000 m in the North Pacific Ocean. PON concentration is greatest in the near-surface waters where
the production of organic matter via photosynthesis
is highest (Figure 4). PON includes both living
(biomass) and nonliving (detrital) components; usually biomass nitrogen is less than 50% of the total
PON in near-surface waters, and less than 10%
beneath the euphotic zone (4150 m). DON concentration is also highest in the euphotic zone (B5–
6 mmol l
À1 ) and decreases systematically with depth
to a minimum of 2–3 mmol l
À1 at 800–1000 m. The
main sources for DON in the surface ocean are the
combined processes of excretion, grazing, death, and
cell lysis. Consequently, DON is a complex mixture
of cell-derived biochemicals; at present, less than
20% of the total DON has been chemically characterized. Dissolved N 2 (not shown) is always high
(B800 mmol l
À1 ) and increases systematically with
depth. The major controls of N 2 concentration are
temperature and salinity, which together determine
gas solubility. Marine life has little impact on N 2
distributions in the open sea even though some
microorganisms can utilize N 2 as a growth substrate
and others can produce N 2 as a metabolic by-product.
These transformations are simply too small to significantly impact the large N 2 inventories in most regions of the world ocean.
Another important feature of the global distribution of NO 3
À is the regional variability in the deep
water inventory (Figure 5). Deep ocean circulation
can be viewed as a conveyor-belt-like flow, with the
youngest waters in the North Atlantic and the oldest
in the North Pacific. The transit time is in excess of
1000 y, during which time NO 3
À is continuously
regenerated from exported particulate and dissolved
organic matter via coupled ammonification and nitrification (Figure 2). Consequently, the deep Pacific
Ocean has nearly twice as much NO 3
À as comparable depths in the North Atlantic (Figure 5).
Nitrous Oxide Production
Nitrous oxide (N 2 O) is a potent greenhouse gas that
has also been implicated in stratospheric ozone depletion. The atmospheric inventory of N 2 O is presently increasing, so there is a renewed interest in the
marine ecosystem as a potential source of N 2 O. Nitrous oxide is a trace gas in sea water, with typical
concentrations ranging from 5 to 50 nmol l
À1
.
105˚E 120˚E 135˚E 150˚E 165˚E 180˚E 165˚W 150˚W 135˚W 120˚W 105˚W 90˚W 75˚W 60˚W
80˚S
70˚S
60˚S
50˚S
40˚S
30˚S
20˚S
10˚S
0˚
10˚N
20˚N
30˚N
40˚N
50˚N
60˚N
70˚N
Longitude
Latitude
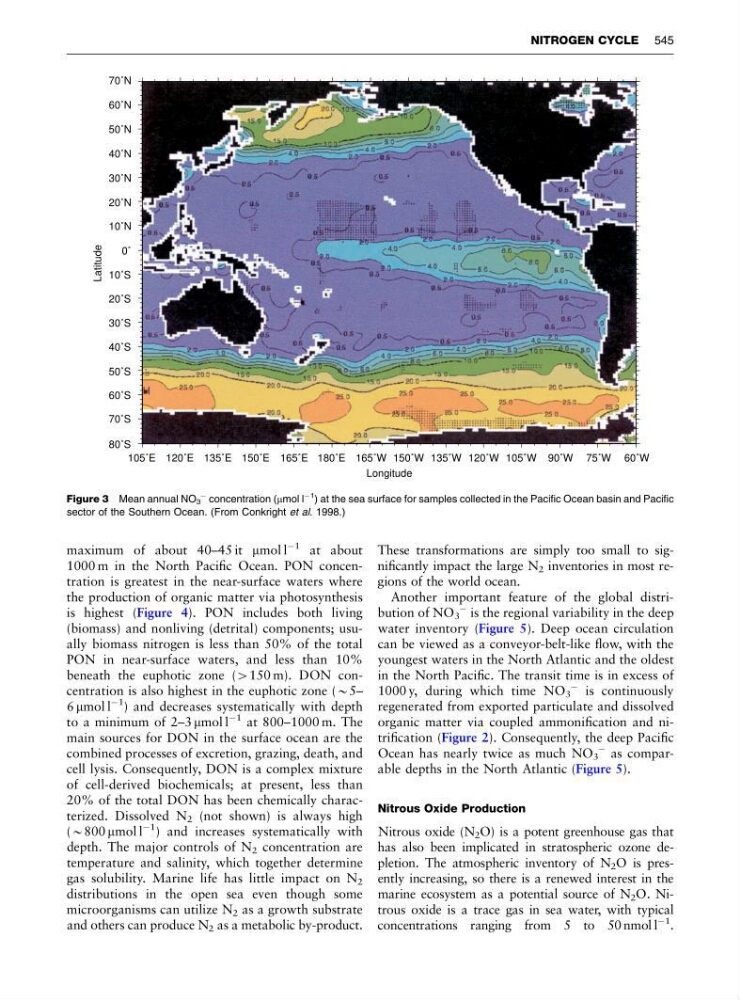
Figure 3 Mean annual NO 3
À concentration (mmol l
À1 ) at the sea surface for samples collected in the Pacific Ocean basin and Pacific
sector of the Southern Ocean. (From Conkright et al. 1998.)
NITROGEN CYCLE 545
À1 at about
1000 m in the North Pacific Ocean. PON concentration is greatest in the near-surface waters where
the production of organic matter via photosynthesis
is highest (Figure 4). PON includes both living
(biomass) and nonliving (detrital) components; usually biomass nitrogen is less than 50% of the total
PON in near-surface waters, and less than 10%
beneath the euphotic zone (4150 m). DON concentration is also highest in the euphotic zone (B5–
6 mmol l
À1 ) and decreases systematically with depth
to a minimum of 2–3 mmol l
À1 at 800–1000 m. The
main sources for DON in the surface ocean are the
combined processes of excretion, grazing, death, and
cell lysis. Consequently, DON is a complex mixture
of cell-derived biochemicals; at present, less than
20% of the total DON has been chemically characterized. Dissolved N 2 (not shown) is always high
(B800 mmol l
À1 ) and increases systematically with
depth. The major controls of N 2 concentration are
temperature and salinity, which together determine
gas solubility. Marine life has little impact on N 2
distributions in the open sea even though some
microorganisms can utilize N 2 as a growth substrate
and others can produce N 2 as a metabolic by-product.
These transformations are simply too small to significantly impact the large N 2 inventories in most regions of the world ocean.
Another important feature of the global distribution of NO 3
À is the regional variability in the deep
water inventory (Figure 5). Deep ocean circulation
can be viewed as a conveyor-belt-like flow, with the
youngest waters in the North Atlantic and the oldest
in the North Pacific. The transit time is in excess of
1000 y, during which time NO 3
À is continuously
regenerated from exported particulate and dissolved
organic matter via coupled ammonification and nitrification (Figure 2). Consequently, the deep Pacific
Ocean has nearly twice as much NO 3
À as comparable depths in the North Atlantic (Figure 5).
Nitrous Oxide Production
Nitrous oxide (N 2 O) is a potent greenhouse gas that
has also been implicated in stratospheric ozone depletion. The atmospheric inventory of N 2 O is presently increasing, so there is a renewed interest in the
marine ecosystem as a potential source of N 2 O. Nitrous oxide is a trace gas in sea water, with typical
concentrations ranging from 5 to 50 nmol l
À1
.
105˚E 120˚E 135˚E 150˚E 165˚E 180˚E 165˚W 150˚W 135˚W 120˚W 105˚W 90˚W 75˚W 60˚W
80˚S
70˚S
60˚S
50˚S
40˚S
30˚S
20˚S
10˚S
0˚
10˚N
20˚N
30˚N
40˚N
50˚N
60˚N
70˚N
Longitude
Latitude
Figure 3 Mean annual NO 3
À concentration (mmol l
À1 ) at the sea surface for samples collected in the Pacific Ocean basin and Pacific
sector of the Southern Ocean. (From Conkright et al. 1998.)
NITROGEN CYCLE 545